[et_pb_section bb_built="1" fullwidth="off" specialty="off" _builder_version="3.0.89" background_image="https://coeli.com/wp-content/uploads//2023/03/Coeli-Renewable-Opportunities_head_fm.jpg" parallax="on" module_class="gen-trustee-single-hero"][et_pb_row][et_pb_column type="4_4"][/et_pb_column][/et_pb_row][/et_pb_section][et_pb_section bb_built="1" fullwidth="off" specialty="off" _builder_version="3.0.89" custom_padding="0px||0px|"][et_pb_row][et_pb_column type="4_4"][/et_pb_column][/et_pb_row][et_pb_row _builder_version="3.0.89" background_position="top_left" background_repeat="repeat" background_size="initial" custom_padding="0px|||" custom_padding_phone="23px|||" custom_padding_last_edited="on|tablet" module_class_2="gen-trustee-single-sidebar" module_class="gen-single-news-content-row "][et_pb_column type="4_4"][et_pb_text admin_label="Tillbaka-knapp" _builder_version="3.0.89" background_layout="light" border_style="solid" custom_margin_tablet="||17px|" custom_margin_last_edited="on|desktop" module_class="gen-back-button hide-in-print" border_style_all="solid"]
Before making any final investment decisions, please read the prospectus, its Annual Report, and the PRIIP of the relevant Sub-Fund here
[/et_pb_text][et_pb_text admin_label="Tillbaka-knapp" _builder_version="3.0.89" background_layout="light" border_style="solid" custom_margin_tablet="||17px|" custom_margin_last_edited="on|desktop" module_class="gen-back-button hide-in-print" border_style_all="solid"]
This material is marketing communication
[/et_pb_text][et_pb_text admin_label="Datum / Skriv ut" _builder_version="3.0.89" background_layout="light" border_style="solid" custom_margin_tablet="||17px|" custom_margin_last_edited="on|desktop" module_class="gen-single-news-date-module gen-trustee-print-module hide-in-print" locked="on" border_style_all="solid"]
[blog_post_date]
Print
[/et_pb_text][et_pb_text _builder_version="3.0.89" background_layout="light"]
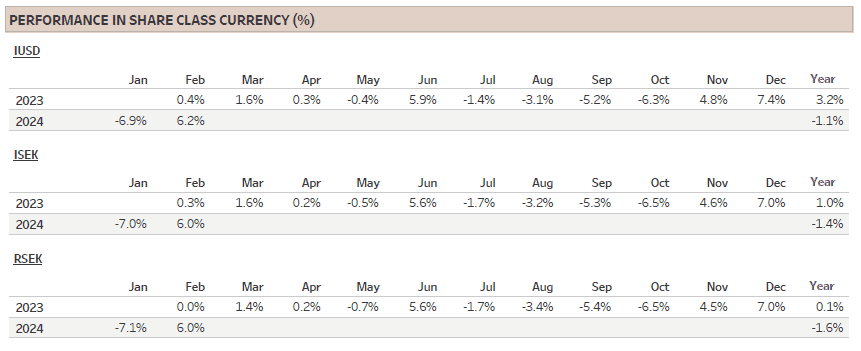
Coeli Renewable Opportunities Monthly Report February 2024 (I USD)
1) Share Class I USD
Performance for other share classes towards the end of the report.
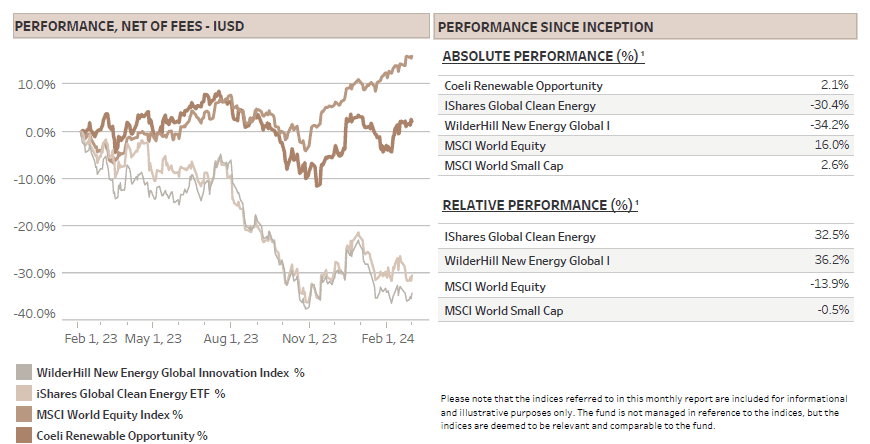
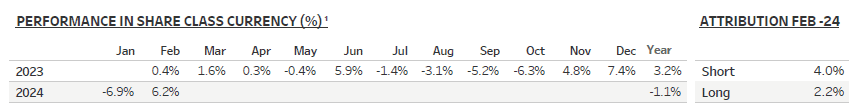
The Coeli Renewable Opportunities fund gained 6.2% net of fees and expenses in February (I USD share class). It is down 1.1% this year and up 2.1% since the inception on February 6, 2023.
The fund outperformed in February the two most comparable indices, the Wilderhill New Energy Global index (NEX) and the iShares Global Clean Energy (ICLN), by 6.5% and 5.5%, respectively, taking the year-to-date outperformance to 12.6% and 9.6%. Since inception, the fund is ahead by 36% and 33%, respectively.
Alpha generation since inception is strong at 11.0%, calculated using CAPM linear regression comparing to the average return of the two most comparable indices. The fund’s active returns have been solid with 12 out of 13 positive months on the short side and 7 positive months on the long side. Active returns are calculated by scaling up the long and short side respectively to 100% and comparing to the average return of the two indices. More on this in the fund performance part.
The fund delivered positive performance on both the long and short side in February, gaining 2.2% and 4.0%, respectively. The main reasons for the strong absolute and relative performance were good stock picking and positioning into earnings season. The hit ratio on long positions trading up post earnings and shorts going down was almost two-to-one versus losses on longs and shorts going higher. The stand-out name was
Chart Industries (GTLS), our largest position, which added 13% on the earnings day. As expected, the company reduced 2024 EBITDA guidance slightly, but this was already in the price, and the stock is up 35% since the bottom in January.
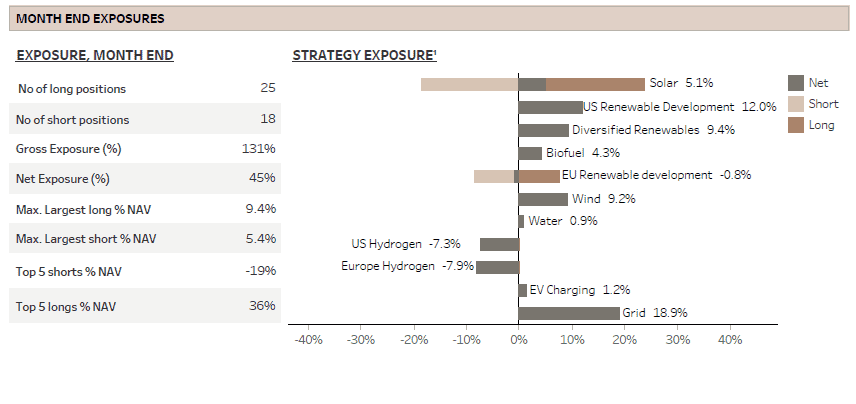
Moreover, in the “Grid” theme, containing only five longs, all companies reported solid Q4 results and rose by an average of 4% on the day of earnings. The companies also, as expected, guided to positive outlooks for 2024 and onwards. On the short side, the hydrogen companies are continuing to struggle to convince the market that they deserve elevated valuations as revenue forecasts are slashed on poor order intake. The two short themes added a combined 2.7% to NAV.
While gross exposure was only slightly reduced from about 135% to 131% into month end, we significantly reduced our net exposure from the high 50s percentage range to 45% at the close of the month. We mainly increased the short side of the book as some attractive opportunities emerged, but also reduced some longs as we will discuss in more depth in the fund performance part.
MARKET COMMENT – FOCUS SHIFTING TO ACTIVITY OVER INFLATION?
The S&P 500 continued its rally in February, setting eight all-time-highs records and closing the month with a 5.2% gain. Contrary to the narrow rally seen in January, February's gains were more broad- based with the S&P 500 equal weight index increasing by 4%. Nevertheless, the ‘Magnificent 7’ still account for about 45% of the year-to-date returns. Although the renewable indices were flat in February, the key small cap index, the Russel 2000, rose by 5.5% and is up on the year.
While FED chairman Powell stated in late January that a March rate cut was unlikely, the market priced out a May cut during February, and June is soon a coin-toss. From five expected cuts at the beginning of January, the bond market is currently only expecting slightly more than three. The main trigger for the change in expectation was of course the strong January inflation data, which combined with mostly strong economic activity numbers, helped cement the view that FED cannot only afford, but would be wise to wait with the first rate cut. As many pundits believe the January inflation numbers were distorted by seasonal effects, it is evident that the February data will be critically important in shaping future monetary policy expectations.
Nevertheless, whereas the November and December rally was fueled by expectations of rate cuts, the January and February rally was powered by a shift in focus from rates relief to better growth prospects. Earnings expectations for S&P 500 this year is up by almost 10% since early February and 2025 is up almost 15%. Of course, most of this is driven by the ‘Magnificent 7’, but the other 493 stocks are also seeing upgrades.
It is a shame that the renewable universe continues to lag the broad market, but we do believe there is light at the end of the tunnel. Earnings have or are about to bottom in many sub-sectors and as long as the rate cutting cycle commences sometime this year, without having been triggered by fears of a recession, which seems unlikely, we believe the prospects are increasingly improving.
HOW CAN YOU TELL IF A FUND IS GREEN?
This is a question with many different answers depending on who you ask. As our fund is focused on decarbonization, it is not a surprise that we believe the most important area to focus on is the energy transition. It is so important to us that we are co-operating with one of the leading Swedish universities to develop a methodology to measure the impact of avoided emissions, a relatively unexplored concept called Scope 4. More on that later.
Back to the initial question. Despite the significant increase in sustainability reporting requirements for funds, particularly in Europe, we doubt that it is much easier than in the past for investors to tell which investment funds are
truly green and not. Funds are now classified into different articles: 6, 8, and 9 depending on how “sustainable” they claim to be. Although most funds truly try their best to make the planet a better place, some seem to use article 9 as a more sophisticated way to greenwash.
Let us quickly review the issue. To be an article 9 fund, the investments shall be
sustainable first and performance focused second. And none of the investments should cause any harm. But what is sustainable? Apparently, most article 9 funds believe 20% or more of a company’s activities need to align to one of the 17 UN Sustainable Development Goals (SDGs). Although all of the 17 SDGs are important, most of them have nothing to do with fighting climate change and some are rather vague. Also, given the 20% limit, a ”sustainable” company could theoretically have up to 80% of its revenues from activities that are not at all linked to sustainable activities, but still qualify as an investment in an article 9 fund that achieves the highest level of sustainability ranking. These funds are often referred to as ‘dark green’ funds independently of which SDGs they are focused.
Talking our own book, our fund is an article 8 fund, which means that the
primary goal is to make a profit for our investors while promoting environmental and social characteristics. However, despite the fact that all our long positions are involved in clean energy production, energy efficiency or decarbonization, we decided to classify the fund as an article 8 or ‘light green’.
Moreover, if we discuss what is commonly thought of as ”green” investments, i.e. investments that improve the environment and fight climate change, there are serious limitations with the current regulatory framework. In our view, this stems partly from the initial approach within the ESG community to exclude polluters or at least only invest in companies with low emissions based on so called scope 1, 2 and 3 emissions.
The focus on scope 1-3 emissions when it comes to climate and emissions reporting is often inadequate and sometimes directly misleading as a measure for green investments. Companies manufacturing solar panels, wind turbines, batteries, or even nuclear energy plants will inevitably have higher emissions in their operations than software companies, banks, or biotech firms. But does this operational footprint genuinely reflect their contribution, or lack thereof, fighting climate change?
This is where Scope 4 emissions become critically important as it attempts to assess the true climate impact of an investment. Scope 4 focuses on the emissions a company’s activities avoid rather than emit. For example, the manufacturing of a wind turbine involves significant emissions from producing steel, copper wires, and the foundation. However, once installed, the turbine generates clean electricity for about 30 years, essentially resulting in negative emissions over its lifetime. To illustrate this point, we have conducted our own comparison between Netflix and Vestas, demonstrating the difference in climate impact. Which stock is the greenest?
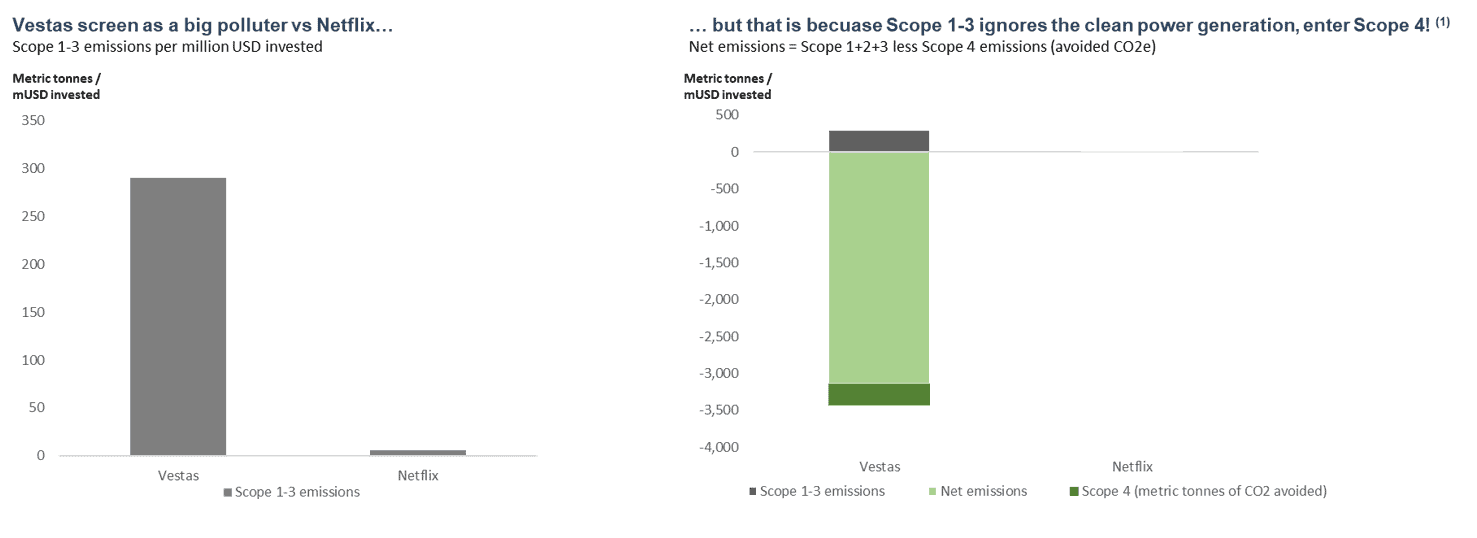 1) Avoided CO2/mUSD invested calculated as net of Scope 1-3 emissions and (capacity sold x baseline emissions x 20yr adjusted capacity factor x USD share of project (simple LCA using NREL estimates for onshore and offshore wind respectively) x 20yrs lifetime) / market cap
Admittedly, there are considerable challenges with measuring scope 4 emissions, but it does not add that much incremental complexity versus measuring scope 1-3. One major hurdle initially is that it is a relatively new concept, and the calculations lack an industry standard. However, we believe the basic concept is straightforward. For instance, OECD countries currently emit about 0.3kg of CO2 emissions per kWh of electricity production, so if a company can produce zero-emission electricity, that is the benchmark amount it avoids per kWh produced.
Nevertheless, Life Cycle Analysis and the allocation of emissions among different companies in the supply chain is one of the complicating factors. This is why we are collaborating with a Swedish university to develop a methodology that will look at the whole value chain. With this initiative we hope to scientifically explain why it is better for the climate to allocate capital to Vestas than to Netflix, which is currently not apparent when looking only at scope 1-3 emissions. This could be valuable for investors who are interested in environmentally positive allocations.
The gist is that if more investors would consider the potentially avoided emissions of their companies, more capital would be incentivized to support businesses that make a tangible difference rather than investing in companies that only have low emissions. Dark green is not always the greenest.
FUND PERFORMANCE – STRONG ALPHA GENERATION OF 11%
The fund gained 6.2% (I USD) in February, its second-best month to date with more than 70% of the themes making a profit and performance coming from both the long and the short side. As already mentioned, as the two most comparable indices, the Wilderhill New Energy Global index (NEX) and the iShares Global Clean Energy (ICLN), were flat on the month, we extended our outperformance. Since inception the relative outperformance increased to 32.5% and 36.2%, respectively.
Of course, comparing a long/short hedge fund with an average historical net exposure of 55% with indices that are 100% long-only gives a certain directional sense of the outperformance. We have therefore calculated the risk adjusted alpha generation since launch using the Capital Asset Pricing Model (CAPM) in a linear regression. We use the average return of the two comparable indices as the input for market return, the US 3-month as risk free return and by running the regression over the daily data since launch, the regression finds two variables, the beta and the alpha. The model, with all its flaws, gives a result of a beta of 0.54 and alpha of 11%.
We have also calculated the active returns of the long and short side separately on a monthly basis. This calculation scales up the long and the short positions to 100% and compares to the average return of the two above mentioned indices. We are pleased although not surprised that our short book has outperformed the indices in 12 out of 13 months. We are also satisfied that the long positions have outperformed in 7 out of 13 months as we have sometimes carried longs that have worked as hedges against large short positions in the short book.

The "Grid" theme emerged as the top performer in February, contributing a 1.9% increase to the Net Asset Value (NAV). Its five members are all in one way or another involved in the build out of the distribution and transmission grid, an activity that is only increasing in importance with accelerating electrification and an increasing share of renewable energy added to the grid. The average order backlog for the five companies is up 180% in the last two years alone and we believe 2024 will be another strong year for the group.
The second-best performing theme was “European Hydrogen”, which contributed 1.9% to NAV. The theme consists of short positions in European based hydrogen companies which as a group are continuing to disappoint on order intake and therefore revenue visibility. The biggest input factor by far in the production of green hydrogen is electricity. Three-four years ago, there was a hope that it would be possible to produce renewable energy at such a low price that limited subsidies would be required to make green hydrogen competitive with grey hydrogen derived from natural gas. However, this has not played out, at least not yet, and it is increasingly obvious that it will be more cost efficient, and better for the climate in most cases, to use green electricity directly instead of taking the inefficient route around hydrogen. Also, to qualify for subsidies, requirements to clean energy used in hydrogen production have become stricter than expected in both the US and the EU. This has caused many developers to postpone projects at best, and at worst cancel. We continue to be skeptical to this space.
The third-best performer was the “Diversified Renewables” theme increasing the NAV by 1.7%. It contains only one long position,
Chart Industries (GTLS), which we have written about in many previous monthly reports. In January the stock sold off triggered by concerns over the Biden administrations’ possible moratorium on LNG export licenses. As we clarified in our last update, even in the event of an outright ban, which seems improbable, GTLS’s business will not be impacted for the next 3-4 years. The other fear in the market is that the company is too levered after the Howden acquisition. However, the company showed improved cash flow generation in Q4 and reaffirmed the free cash flow guidance for 2024. The stock is trading in line with its historical valuation, but as the Howden acquisition added significantly more service revenues and a broader industry footprint, we believe the stock should eventually trade closer to industrial peers with a more than 50% higher valuation multiple.
The worst performing theme of the month was “US Renewable Development”, losing 0.9% of NAV. This despite decent Q4 results from both of our two long positions
Nextera Energy (NEE) and
AES. However, we believe both are extremely well positioned to benefit from AI data center demand for renewables and we are likely to expand this theme with more companies going forward.
The last theme worth mentioning is the “Solar” theme which only added 0.2% to NAV. We came into the year optimistic to utility scale solar growth for 2024 and expected our holding in
Array Technologies (ARRY) to both benefit and rerate from the seemingly depressed valuation level. We may be right on the solar market, but we were flatly wrong on
ARRY, at least in the near term. There has seldom been such a wide discrepancy between what we hear from management on their market position and what seems to be happening in the market space. We cannot get to another conclusion than ARRY is losing significant market share, not only to its largest public competitor
NEXTracker (NXT) but also to private companies and foreign new entries in the US market.
ARRY gained significant market share in 2022 only to lose it in 2023-2024. This may change in 2025, given the phasing and long duration of utility scale solar projects, but we believe now is not the time to own the stock. We took advantage of the positive share price reaction around earnings to exit the position.
The utility scale market growth in 2024 is likely to be slower than we expected only some months ago, but this is not due to demand, but rather due to project postponements following permit and interconnection delays, and customers awaiting final IRA guidelines. However, we believe these problems are solvable as utility scale solar is still the cheapest form of energy in the US and in most of the world. With accelerated electrification of industry and transportation including the rapid growth in AI data centers, cheap energy will surely be in demand.
Sincerely
Vidar Kalvoy & Joel Etzler
[/et_pb_text][et_pb_team_member _builder_version="3.0.89" name="Joel Etzler" background_layout="light" header_level="h6" position="Portfolio Manager, Coeli Renewable Opportunities" disabled_on="on|on|on" disabled="on" /][et_pb_team_member _builder_version="3.0.89" name="Vidar Kalvoy" background_layout="light" header_level="h6" position="Portfolio Manager, Coeli Renewable Opportunities" disabled_on="on|on|on" disabled="on" /][et_pb_post_title _builder_version="3.0.89" title="on" meta="off" author="off" date="off" categories="off" comments="off" featured_image="off" featured_placement="below" text_color="dark" text_background="off" border_style="solid" module_class="gen-single-news-heading-module gen-trustee-single-headline" date_format="d M, Y" border_style_all="solid" disabled_on="on|on|on" disabled="on" /][et_pb_text admin_label="Coeli Nordic Corporate Bond Fund R-SEK" _builder_version="3.0.89" background_layout="light" module_class="gen-table-module" disabled_on="on|on|on" disabled="on"]
Coeli Nordic Corporate Bond Fund
| Performance in Share Class Currency | 1 Mth | YTD | 3 yrs | Since incep |
| Coeli Nordic Corporate Bond Fund - R SEK | 1.30% | -0.93% | 3.38% | 14.52% |
| | | | |
[/et_pb_text][et_pb_text admin_label="Coeli Nordic Corporate Bond Fund R-SEK" _builder_version="3.0.89" background_layout="light" module_class="gen-table-module" disabled_on="on|on|on" disabled="on"]
[cg_linear_graph id="31122"]
[/et_pb_text][et_pb_image _builder_version="3.0.89" src="https://coeli.com/wp-content/uploads//2020/10/ncbr.png" show_in_lightbox="off" url_new_window="off" use_overlay="off" always_center_on_mobile="on" force_fullwidth="off" show_bottom_space="on" disabled_on="on|on|on" disabled="on" /][et_pb_image _builder_version="3.0.89" src="https://coeli.com/wp-content/uploads/2019/01/Gustav-Fransson6.jpg" show_in_lightbox="off" url_new_window="off" use_overlay="off" always_center_on_mobile="on" force_fullwidth="off" show_bottom_space="on" custom_margin="||21px|" disabled_on="on|on|on" disabled="on" /][et_pb_text admin_label="Namn och title" _builder_version="3.0.89" background_layout="light" module_class="gen-single-ingress-module" custom_margin="||40px|" disabled_on="on|on|on" disabled="on"]
Gustav Fransson
Portfolio Manager of Coeli Nordic Corporate Bond Fund
[/et_pb_text][et_pb_image _builder_version="3.0.89" src="https://coeli.com/wp-content/uploads/2018/10/Alexander-Larsson-Vahlman.jpg" show_in_lightbox="off" url_new_window="off" use_overlay="off" always_center_on_mobile="on" force_fullwidth="off" show_bottom_space="on" custom_margin="||21px|" disabled_on="on|on|on" disabled="on" /][et_pb_text admin_label="Namn och title" _builder_version="3.0.89" background_layout="light" module_class="gen-single-ingress-module" custom_margin="||40px|" disabled_on="on|on|on" disabled="on"]
Alexander Wahlman
Senior Analyst
[/et_pb_text][et_pb_text admin_label="Top Holdings (%)" _builder_version="3.0.89" background_layout="light" custom_margin="||20px|" module_class="gen-trustee-single-table" disabled_on="on|on|on" disabled="on"]
Top Holdings (%)
| LANSBK 1.25% 18-17.09.25 | 4.1% |
| NORDEA HYP 1.0% 19-17.09.25 | 4.1% |
| SWEDBK 1.0% 19-18.06.25 | 4.1% |
| WHITE MOUNT FRN 17-22.09.47 | 3.9% |
| B2 HOLDING FRN 19-28.05.24 | 2.9% |
[/et_pb_text][/et_pb_column][/et_pb_row][et_pb_row _builder_version="3.0.89" custom_padding="23px||23px|" custom_padding_last_edited="on|phone" box_shadow_position="outer" use_custom_gutter="on" gutter_width="4" custom_padding_tablet="0px||0px|" module_class="gen-pop-up-row gen-wide-sidebar-content-row gen-kapitalforvaltare-row" disabled_on="on|on|on" disabled="on"][et_pb_column type="1_3"][et_pb_blurb admin_label="Joel" _builder_version="3.0.89" url_new_window="off" use_icon="off" use_circle="off" use_circle_border="off" icon_placement="top" use_icon_font_size="off" background_layout="light" border_style="solid" image="https://coeli.se/wp-content/uploads/2019/08/Joel-Etzler-1.jpg" animation="off" text_orientation="center" header_text_align="center" body_text_align="center" alt="Fondförvaltare Joel Etzler" border_style_all="solid"]
Joel
[/et_pb_blurb][et_pb_text admin_label="Text / LinkedIn" _builder_version="3.0.89" background_layout="light" border_style="solid" module_class="gen-linked-in-module" border_style_all="solid"]
Joel Etzler
Portfolio Manager Coeli Renewable Opportunities
[/et_pb_text][et_pb_text admin_label="Popup" _builder_version="3.0.89" background_layout="light" border_style="solid" module_class="gen-pop-up-module" border_style_all="solid" disabled_on="on|on|on" disabled="on"]
Christofer Halldin
Fondförvaltare Coeli Circulus
Christofer förvaltar Coeli Circulus sedan starten augusti 2022. Innan det arbetade han som chef för den aktiva aktie- & ränteförvaltningen hos Handelsbanken (HB) Fonder. Där var han med och utvecklade Handelsbanken Fonder till en av Sveriges mest framgångsrika aktie- och ränteförvaltare under slutet av 2010-talet, då HB Fonder hade störst nettoinflöden på den svenska fondmarknaden flera år i rad. HB Fonder utsågs även under den tiden till både årets förvaltare och årets hållbara förvaltare av aktörer som Prospera, Privata Affärer, Söderberg & Partner, Länsförsäkringar m fl. Innan Christofer utsågs till chef för den aktiva förvaltningen förvaltade han under flera år olika globalmandat. Han har också arbetat sju år, 2007-2013, som förvaltare i USA av både Amerika-, Brasilien- och Latinamerikafonden på HB Fonder.➜ Kontakt:christofer.halldin@coeli.se➜ LinkedIn➜ Twitter➜ Instagram
[/et_pb_text][/et_pb_column][et_pb_column type="1_3"][et_pb_blurb admin_label="Vidar" _builder_version="3.0.89" url_new_window="off" use_icon="off" use_circle="off" use_circle_border="off" icon_placement="top" use_icon_font_size="off" background_layout="light" border_style="solid" image="https://coeli.se/wp-content/uploads/2019/10/Vidar-Kalvoy.jpg" animation="off" text_orientation="center" header_text_align="center" body_text_align="center" alt="Portfolio Manager Vidar Kalvoy" border_style_all="solid"]
Vidar
[/et_pb_blurb][et_pb_text admin_label="Text / LinkedIn" _builder_version="3.0.89" background_layout="light" border_style="solid" module_class="gen-linked-in-module" border_style_all="solid"]
Vidar Kalvoy
Portfolio Manager Coeli Renewable Opportunities
[/et_pb_text][et_pb_text admin_label="Popup" _builder_version="3.0.89" background_layout="light" border_style="solid" module_class="gen-pop-up-module" border_style_all="solid" disabled_on="on|on|on" disabled="on"]
Joakim By
Fondförvaltare Coeli Circulus
Joakim förvaltar Coeli Circulus sedan starten augusti 2022. Innan det arbetade han som förvaltare av Amerika Småbolag hos Handelsbanken Fonder. Han förvaltade Amerika Småbolag från 2015 och vann flera utmärkelser för den goda avkastningen i fonden som också växte kraftigt under hans tid som förvaltare. När Joakim lämnade fonden i början på 2022 hade den över 20 miljarder kronor i förvaltat kapital. Innan han förvaltade Amerika Småbolag ansvarade han bland annat för den bredare fonden Amerika Tema, 2013-2017, och globalfonden Global Tema, 2009-2013, hos Handelsbanken Fonder.➜ Kontakt: joakim.by@coeli.se➜ LinkedIn➜ Twitter➜ Instagram
[/et_pb_text][/et_pb_column][et_pb_column type="1_3"][/et_pb_column][/et_pb_row][et_pb_row _builder_version="3.0.89" custom_padding="23px||23px|" custom_padding_last_edited="on|phone" box_shadow_position="outer" use_custom_gutter="on" gutter_width="4" custom_padding_tablet="0px||0px|" module_class="gen-pop-up-row gen-wide-sidebar-content-row gen-kapitalforvaltare-row" disabled_on="off|off|off" disabled="off"][et_pb_column type="1_2"][et_pb_blurb admin_label="Joel" _builder_version="3.0.89" url_new_window="off" use_icon="off" use_circle="off" use_circle_border="off" icon_placement="top" use_icon_font_size="off" background_layout="light" border_style="solid" image="https://coeli.com/wp-content/uploads/2024/01/Joel1.jpg" animation="off" text_orientation="center" header_text_align="center" body_text_align="center" alt="Fondförvaltare Joel Etzler" border_style_all="solid"]
Joel
[/et_pb_blurb][et_pb_text admin_label="Text / LinkedIn" _builder_version="3.0.89" background_layout="light" border_style="solid" module_class="gen-linked-in-module" border_style_all="solid"]
Joel Etzler
Portfolio Manager Coeli Renewable Opportunities
[/et_pb_text][et_pb_text admin_label="Popup" _builder_version="3.0.89" background_layout="light" border_style="solid" module_class="gen-pop-up-module" disabled_on="off|off|off" disabled="off" border_style_all="solid"]
Joel Etzler
Portfolio Manager Coeli Renewable Opportunities
- Portfolio Manager Coeli Renewable Opportunities
- Joined Coeli in 2019
- More than 13 years of experience from the financial industry
- MSc from the Royal Institute of Technology
Joel Etzler is Portfolio Manager and Founder of the Coeli Renewable Opportunities fund and has more than 13 years in the industry, with investment experience from both the public and private equity side. Etzler joined Kalvoy at Horizon Asset in London in 2012 and spent five years before that within Private Equity at Morgan Stanley. Etzler started his investment career within the technology sector at Swedbank Robur in Stockholm, 2006.
[/et_pb_text][/et_pb_column][et_pb_column type="1_2"][et_pb_blurb admin_label="Vidar" _builder_version="3.0.89" url_new_window="off" use_icon="off" use_circle="off" use_circle_border="off" icon_placement="top" use_icon_font_size="off" background_layout="light" border_style="solid" image="https://coeli.com/wp-content/uploads/2024/01/Vidar-Kalvoy-1.jpg" animation="off" text_orientation="center" header_text_align="center" body_text_align="center" alt="Portfolio Manager Vidar Kalvoy" border_style_all="solid"]
Vidar
[/et_pb_blurb][et_pb_text admin_label="Text / LinkedIn" _builder_version="3.0.89" background_layout="light" border_style="solid" module_class="gen-linked-in-module" border_style_all="solid"]
Vidar Kalvoy
Portfolio Manager Coeli Renewable Opportunities
[/et_pb_text][et_pb_text admin_label="Popup" _builder_version="3.0.89" background_layout="light" border_style="solid" module_class="gen-pop-up-module" disabled_on="off|off|off" disabled="off" border_style_all="solid"]
Vidar Kalvoy
Portfolio Manager Coeli Renewable Opportunities
- Portfolio Manager Coeli Renewable Opportunities
- Joined Coeli in 2019
- 25 years of experience from the financial industry
- MBA from IESE, MSc from Norwegian School of Economics and Business Adm.
Vidar Kalvoy is the lead Portfolio Manager and Founder of Coeli Renewable Opportunities fund. He has 25 years of experience from portfolio management and equity research. For nine years he was responsible for the energy investments at Horizon Asset in London, a market neutral hedge fund. Kalvoy also did energy investments at MKM Longboat, another hedge fund in London. He started his financial career as a sell side equity research analyst focusing on the technology and telecom sector, working six years in Oslo and Frankfurt. Prior to working in finance, he was a second lieutenant in the Norwegian Navy.
[/et_pb_text][/et_pb_column][/et_pb_row][et_pb_row _builder_version="3.0.89" background_position="top_left" background_repeat="repeat" background_size="initial" module_class="gen-single-news-content-row gen-trustee-single-content-row" custom_padding="0px|||" custom_padding_phone="23px|||" custom_padding_last_edited="on|tablet" module_class_2="gen-trustee-single-sidebar" disabled_on="on|on|on" disabled="on"][et_pb_column type="2_3"][et_pb_text admin_label="Tillbaka-knapp" _builder_version="3.0.89" background_layout="light" border_style="solid" custom_margin_tablet="||17px|" custom_margin_last_edited="on|desktop" module_class="gen-back-button hide-in-print" border_style_all="solid"]
Note that the information below describes the share class (I SEK), which is a share class reserved for institutional investors. Investments in other share classes generally have other conditions regarding, among other things, fees, which affects the share class' return. The information below regarding returns therefore differs from the returns in other share classes.
Return to Fund page
[/et_pb_text][et_pb_text admin_label="Datum / Skriv ut" _builder_version="3.0.89" background_layout="light" border_style="solid" custom_margin_tablet="||17px|" custom_margin_last_edited="on|desktop" module_class="gen-single-news-date-module gen-trustee-print-module hide-in-print" locked="on" border_style_all="solid"]
[blog_post_date]
Print
[/et_pb_text][et_pb_post_title _builder_version="3.0.89" title="on" meta="off" author="off" date="off" categories="off" comments="off" featured_image="off" featured_placement="below" text_color="dark" text_background="off" border_style="solid" module_class="gen-single-news-heading-module gen-trustee-single-headline" date_format="d M, Y" border_style_all="solid" /][et_pb_text _builder_version="3.0.89" background_layout="light"]
Utveckling september
Fondens värde sjönk -5,1 procent i september (andelsklass I SEK). Stoxx600 (brett Europaindex) sjönk under samma period med -3,4 procent och HedgeNordics NHX Equities var preliminärt oförändrat. Motsvarande siffror för 2021 är en ökning om +21,6 procent för fonden, +14,0 procent för Stoxx600 och +6,4 procent för NHX Equities.


Equity markets / Macro environment
After seven consecutive months of positive performance the world’s stock markets were poised for some degree of turbulence. Volatility was especially high in some equities and on Monday, September 20, the highest nominal volume ever traded was reached in options on the S&P500 (!) The broad European index fell by 3.4 percent in September compared to the S&P500 which fell by 4.8 percent. The fund also had its first negative performance since October last year with a decline of 5,1 percent. More about that later.
Despite high levels for many stock indices, sentiment among investors has been relatively gloomy. Bank of America's monthly survey recently showed that only 13 percent of managers expect a positive market in the future, which is the lowest figure since April 2020 (and that was clearly wrong). The reasons cited are China's growth problems, the crisis-stricken Chinese real estate giant Evergrande, the development of the delta variant, declining profit growth and, of course, rising inflation. However, they are still overweight equities which is perhaps not so strange when you have to pay to lend your capital to countries. As interest rates rose at the end of the month, the German 10-year interest rate followed with a giant step from - 0.25 percent to - 0.17 percent… The picture below is an overall risk indicator, and we are around zero (neutral).

The news flow in September began with record high inflation figures in Europe at +3.0 which exceeded market expectations. The corresponding figure in July was + 2.2 percent. It was the fastest growth rate since November 2011 and several countries recorded up to five percent in inflation rate. The pressure on the ECB to reduce its support measures is increasing. On Friday, October 1, new inflation figures came in for September, which showed a further acceleration in the inflation rate by +3.4 per cent.
The rate of change can be mostly attributed to rising energy prices that are starting to create real problems in the world's economies as well as agricultural shifts. The picture below shows that food prices are at record high levels over the past 60 years. The biggest losers are the poorest part of the population.

In the slightly longer term it is forecasted that it is not excessive demand that will drive inflation, but rather a limited supply, and then both in terms of products and labour. At the end of September, long queues were reported at petrol stations across the UK when fuel ran out and there were not enough truck drivers to refuel. Prime Minister Boris Johnson urges his citizens to refuel sensibly and at a normal rate. You wanted Brexit, so there you go. In sheer desperation, Johnson has now issued 5,000 temporary short-term visas for temporary drivers. Good luck.
M25 spring 2022?

Below are European gas prices which have risen in a seemingly uncontrolled fashion and recorded the highest September prices ever. A silent prayer for the mild winter. We guess that this development will soon be a major topic in the media, and it will undoubtedly create various problems and somewhat reduce next year's expected growth. It feels reassuring that Per Bolund (Swedish Green Party MP) claims that there is no electricity shortage in Sweden because then the costs for ordinary people would be unbearably high during the winter (which of course they will be). Rising gas and electricity prices have led European politicians to start discussing billion-dollar subsidies (in euros) to households and manufacturers who will experience sharply rising electricity bills over the winter.

Source: Bloomberg
Henrik Svensson, site manager at the oil-fired power plant in Karlshamn (south Sweden), does not agree with Per Bolund that we have a surplus of electricity in the country. For large parts of September, the power plant ran at full capacity and burned 240k liters of oil per hour. Henrik Svensson believes that it is electricity shortages and high electricity prices that are behind the high production. He also says that there is a lack of planned power production in southern Sweden and that it will take many years before the electricity grid is strengthened and new electricity production is in place. Sweden today burns more oil than we have done in 10 years. A gigantic energy policy and climate policy failure signed by the Green Party.

Source: Steget efter
Winning candidate for this year's Christmas presents below.

The change in the US 10-year interest rate created considerable pressure on, primarily, growth stocks at the end of the month. The performance dispersion for different sectors was very large in September with oil shares as a clear winner. This was also felt in the last days of September.

Source: Bloomberg
Below is the development for the US 10-year interest rate. The turbulence in the stock market was caused by the change in interest rate level breaking through on the upside, as can be seen in the chart.

There have been countless attempts to explain the turbulence in recent weeks. The recent and significant amount of options being exercised, Evergrande, interventions by the Chinese government, Fed tapering, Bank of England expected to raise interest rates, delta variant, inflation, bottlenecks in production, difficulties in finding staff, rising energy prices and declining growth rates. We think it is enough to look at the picture below. Rising interest rates hit hard at growth companies' valuations.

Goodbye Mutti and thank you for an extraordinary effort for Europe!

Source: Nyhetsbyrån TT
She was politically in a class of her own during the euro crisis ten years ago and Sweden also has her to thank for a lot. Despite a somewhat weaker performance in recent years, German citizens have experienced significantly better economic development than many others.

On September 29, the covid-19 restrictions in Sweden were finally removed and we can now, in principle, start living a normal life again. The number of bookings for winter holidays skyrocketed to the great joy of the tourist and transport industry. In recent months, tourism activity in the Mediterranean has been "extraordinary" and much better than forecasted before the summer. Luxury travel is also reaching new heights. Private jet passengers to Mallorca increased by +70 percent in July compared to July 2019 with an average of 83 private jets per day landing in Palma. If you want to rent a yacht, you are being referred to next year as basically everything has already been fully booked.
We now belong to a minority group. Passively managed capital exceeds actively managed capital for the first time ever. This will give us more opportunities as mispricing increases.

In addition to being one of the world's best stock markets this year, Sweden also has the most listed companies in the entire EU. Bloomberg drew attention to the fact that there are now around 1,000 listed companies on the various trading platforms in Stockholm. More than 80 percent are smaller companies, and the list is filled with new listings every day until Christmas! For us, it is interesting as we are constantly looking for new potential core holdings. In recent weeks, we have identified one which we write about under Long Positions.
We end this section with a picture that well reflects today's political level.

Source: Kluddniklas
Long positions
Truecaller
During September, we did a lot of work on the Swedish company Truecaller which will go public on October 8th. Truecaller is one of the most interesting companies we’ve seen in recent years. Truecaller has developed a phone application that can, among other things, identify unwanted calls from, for example, telemarketers. The app is one of the top ten most downloaded applications globally, and in some of the main markets such as India, Nigeria and Indonesia, it is one of the three most downloaded apps. As a Swedish company with headquarters in Stockholm, the firm has chosen to list on the Swedish stock exchange, which we are very happy about.
Truecaller was founded in 2009 by Alan Mamedi and Nami Zarringhalam. They met at the Royal Technical University in Stockholm, and they continue to be active in the company as the CEO and Chief Strategic Officer (CSO), respectively. When they released the first version of the app, they received 10,000 downloads within one week. By 2013 they had reached over 10 million users globally and in Q2 2021 they had reached 278 million monthly users. Throughout their journey, Truecaller has attracted several well-known investors such as Sequoia Capital (early investors in Apple, Whatsapp, and Zoom among others), Atomica (Skype-founder Niklas Zennström’s investment company), and Kleiner Perkins (early investors in Google, Amazon, and Spotify among others).

Until recently, revenue streams have mainly consisted of income from in-app advertising. In addition to this, there is a premium version where paying users can get additional functionalities. That business accounted for around 20 percent of revenues in 2020. During the fall of 2020, Truecaller launched a corresponding offering that targets corporates. This part of the business allows B2B customers to be listed as verified callers when they call private people. It can for example be a security company that calls about an alarm or a courier company that needs to get in contact with a receiving customer. It is a common problem that these types of companies get rejected when the call-receiver doesn’t recognize the number.
Truecaller declares that their product benefits from network effects. i.e., the product gets better the more people who use it (think Facebook). This can be relatively easy to appreciate since phone number identification inherently evolves from reporting of unwanted calls by the users, i.e., when enough people have reported an unwanted call Truecaller flags for this in the app). Over time, Truecaller has built a database containing 5.7 billion unique phone-identities. Network effects doesn’t just build a better product over time, they also increase the entry-barriers for potential competition.
The majority of Truecaller’s income comes from developing countries. The company explains that the problems related to spam emails, harassment, unwanted calls, and messages are more common there than in the western world. India is Truecaller’s largest market where these types of problems are significant. One positive aspect of the geographical exposure is that it allows for a nice structural tailwind: the population growth in developed markets is much higher than in the west (driven by an increasing average age) and the smartphone penetration is growing fast.
Historically, 97 percent of all app downloads have been organic. However, management has begun to experiment with user acquisitions by the way of advertisements through, for example, Facebook. The returns on user acquisition looks extremely attractive. In some markets, such as India, Truecaller could achieve a return on investment of up to 20x on every spent dollar. In more mature markets, such as the USA, the same multiple amounts to 4x, still very attractive. Indonesia, which is a relatively new market to the company, has a multiple of 0.8x. This means any user acquisition spend in Indonesia is unprofitable at this point. However, management is confident that the return profile will wander above the 1x as more users join and the network effects take place. In summary, the investment opportunities are plentiful and attractive – and unique.
In summary, several things speak for significant growth in the future. The investment in paid user acquisition, a sharpened premium-offer, the newly launched B2B product and continued growth of the advertising business. In addition to this, acquisitions may likely follow.
Growth has been prioritized over profitability and it is only recently that the company began to report profits. In 2019 sales grew by 57 percent. In 2020 the corresponding figure was 64 percent, and during the first half of 2021 the company’s sales grew with as much as 151 percent in comparison to the same period last year (which was partly affected by the pandemic). During the first half of this year, the company’s operating margin was 32 percent. As you can imagine, Truecaller is very capital-efficient. Working capital is very low which gives a nice cash conversion and a very high return on capital employed – all attributes that are required to create a very successful and valuable company over time.
Truecaller targets a revenue growth of at least 45 percent between 2021-2024e. After 2024 the EBITDA-margin should be at least 35 percent. The sum of the year-on-year growth and the EBITDA-margin should amount to at least 70 percent (a variant of the rule of 40 that tries to balance growth and profitability). We don’t think it will be difficult to reach these targets and the analyst estimates we have looked at are cautious, especially regarding profitability. In our preliminary prognosis for 2023, our EBITDA-estimate is around 16 percent ahead of the analyst estimates that we’ve studied. This is based on that Truecaller can continue to grow sales much faster than hiring new people while the gross margin improves slightly in coming years.
The gross margin is an interesting aspect of the equity story. Truecaller’s gross margin amounts to approximately 70 percent. Most of the cost of sales consists of platform fees to Apple and Google. Since Apple and Google practically control the distribution channels for apps together, a duopoly has occurred and prices for app-developers such as Truecaller have remained high around 25-30 percent of sales. This situation is now heavily criticized from all parts of the world since the situation is not considered competitive, for example
look at this analysis about an American court ruling concerning a twist between Epic Games and Apple. We believe Google and Apple’s fees will decrease over time – which would be a positive event for Truecaller. Furthermore, Truecaller’s new business deal bypasses Goggle and Apple, which gives a gross margin of close to 100 percent. This will strengthen the profitability even more.
There are of course risks associated with the dependence on Google/Apple (which is the case for every company in the application business); the geographical exposure and one should never write off the threat of competition even if it seems far away at this stage. However, we do believe the benefits outweighs the negatives. Truecaller has excellent financial characteristics, operational founders with large shareholdings who will remain active in the business and some of the world’s most well-known investors behind it. We therefore look forward to being included as an anchor investor ahead of the stock exchange listing on October 8th. We are even more excited to follow the company’s successes in current and new markets in the coming years.
CVS Group
One of the happiest days of the month was when our veterinarian company CVS Group released their interim numbers. Once again, the company beat analysts’ expectations which have been raised several times over the course of the year. In the first two months of the new financial year (which begins in July), the company has grown by 17 percent. This can be compared with the growth expectations for the full year which, before the report release, were 7 percent. Once again, analysts have thus far been “forced” to upgrade their assumptions. In a sour September stock market, the share fell 3 percent.
It becomes clear that the positive effect of the pandemic on pet ownership is more tenacious than ever. Pets live for many years, and we believe many underestimated the importance of the large number of new customers during the pandemic. Below is a graph of Google searches for veterinarians in the UK as well as data from the Swedish Board of Agriculture regarding the number of newly registered dogs. We speculate that the UK has similar trends as Sweden. The data points are also positive for our other pet company Swedencare. Pet companies are obviously still hot; right now there’s a bidding war going on over the German pet company Zooplus, where EQT is currently in the lead with the highest bid. We also note that there have been several venture capital-led acquisitions of veterinary companies at higher multiples than CVS is valued at.

Source: Jordbruksverket, Coeli

Source: Google Trends, Coeli
Lindab
Since our first investments in Lindab in the autumn of 2019, the thesis has always been that the building systems business segment did not fit into the business and in September, management finally found a buyer for the company. The transaction entails a write-down of goodwill corresponding to SEK 430 million, but it is cash flow neutral. Lindab took the opportunity to update its financial targets; the company now wants to grow by 10 percent per year (of which approximately two thirds are through acquisitions) and reach an operating margin of at least 10 percent (previously 10 percent over a business cycle). The share responded positively to the message.
We noted broad insider purchases in Lindab during the month, also from CEO Ola Ringdahl himself, which we think bodes well for the report in October. Despite this the share price decreased 8 percent in September.
Victoria
We have written several times about the British flooring company Victoria, which in September had a weak share price development of 17 percent. By all accounts, the company is doing well – during the month it was reported that sales rose 70 percent compared to 2020, and 50 percent compared to 2019. If you only partially extrapolate these figures for the rest of the year, it is obvious that analysts’ expectations are too low. We believe that this month’s decline is related to flows: growth companies and small and mid-cap companies were some of the most affected sectors in September – Victoria was hit from both sides. We have increased our position in recent days.
The Pebble Group
One of the month’s (few) joys was Pebble Group. As we previously wrote, the company is active in the market for gift advertising, i.e. gifts that companies give to customers, employees, and other stakeholders for marketing purposes. In September the company came out with its half-year figures that were better than expected. Pebble’s software division, Facilisgroup, is growing better than our expectations. This is also the part we believe the market is valuing too low. The stock rose 10 percent in September.
Knaus Tabbert
During the last trading day in September, our German motorhome manufacturer Knaus Tabbert announced that the forecasts for 2021 must be lowered due to component shortages. We are not particularly surprised that this has happened given what we have seen from other vehicle manufacturers. If the company can remedy these supplier problems, management believes that 2022 will be unaffected at best, as Knaus still has a bursting order book, increased production capacity and more suppliers from January next year. The share fell 7 percent in September.
Short positions
The short portfolio contributed with a negative result during the month. Our short-term negative positions in the German DAX had the largest negative contribution. Some stock specific short positions that contributed positively to the result were Swedish Dometic, German Henkel and Norwegian NEL.
Exposure
The net exposure, adjusted for our unlisted holdings, at the beginning and end of the month was 76 and 74 percent, respectively.
Summary
September's negative return of x percent also meant the end of the fund's, so far, longest period of positive return (10 months). We are obviously disappointed with that, but we have been in the game long enough to understand that equities sometimes must fall to be able to refuel and continue their upward trajectory. In general, September was the weakest month for many equities since the crisis started 1.5 years ago. September, otherwise, started strong for us and was a continuation of an unusually good performance at the end of August. Our companies presented many good news (except for Knaus Tabbert on the last day of the month) but small-caps and especially those categorized as growth shares, had a very weak performance during September. The main reason for this was, as previously mentioned, the change in the US long-term interest rate and general "risk off".
The picture below shows the development since March last year compared with the corresponding time intervals in the financial crisis in 2009 and onwards. Both periods have shown an unusually strong recovery and the current trend is even stronger than when the financial crisis raged 12 years ago.

Source: Goldman Sachs
Since the crisis started 1.5 years ago, we have had three different phases. The first and shortest, "despair", showed a decline in prices of 33 percent. The second phase, "hope", ended at the beginning of this year and showed a very strong return of 79 percent despite declining earnings. The last, “growth”, where we are now, has shown +11 percent in share prices with sharply rising growth for companies' earnings, but at lower valuations.

Source: Goldman Sachs
The recovery for American companies (below) has been extremely strong and compared to 2019, the 2021 profits will be approximately 36 percent higher. Very impressive.

Source: Goldman Sachs
It is very gratifying that Europe, for once, is keeping up with the United States and showing strong profit growth. Compare this with the non-existent profit growth between 2007–2019 (!)

Despite rising equity prices, valuations have fallen and Europe is now trading around 16x the profit 12 months ahead. It's not very strenuous (we think). For an average commercial property, you can get a return of maybe 3 percent before net financial costs. After financing, this corresponds to at least P/E 50x. And paying to lend to different countries does not feel like an exciting alternative either.

Source: Goldman Sachs
The valuation of global shares in relation to global GDP looks more strained. A major reason for this is the central banks' aggressive policy.

The valuation of the major leading technology companies is at an average level seen from the last five years.

Source: Goldman Sachs
The image below is striking. It shows that Swedish property prices, which have risen by almost 200 percent over the past 15 years, have had the same development as the money supply. In theory, price per m2 and krona is unchanged for the past 15 years. Is there anyone who still doubts that the world's central banks are responsible for the largest wealth creation in human history? It is important to be on the wagon because when it is gone you’ve missed it. And what central banks cannot push, the price of bitcoin for example, rises even more as central banks cannot make more of it. The opportunities for central banks to reverse the band are few. In the long run, this means that the next 10 years will, overall, be a good period for, for example, stock picking. All forms of uniqueness (growth) will be highly valued to compensate for the fact that the value of money decreases at a rapid pace.

If there is anyone who is still not convinced, take a look at the picture below. The market capitalization of the S&P500 divided by the Fed's balance sheet….

Source: Bloomberg
Onwards and upwards. The wealth of American households is accelerating away from the change in GDP.

Thank you Fed and all the world central banks!

Citigroup's surprise index has weighed down and analysts' profit estimates are also starting to soften. Not a good combination and it has undoubtedly contributed to the weak development in the stock markets recently.

It took a full 219 days for the S&P500 to have a decline of 5 percent. We will see how high the next bar will be.

Timing is everything. A fascinating graph that shows the importance of having reasonable timing in decisions.

Source: Goldman Sachs
Despite a difficult month behind us, it feels reasonable to expect a stronger market during the last quarter of the year. Our view is that we are still in a rising market, although we are likely to experience some turbulence for a few more weeks. "Bear markets" are constantly declining with sharp rallies while "bull markets" continue to rise with some strong drawdowns. We therefore believe that we are still in a rising market.
Some statistics to cheer you up. The S&P500 managed to rise by 0.2 percent in the third quarter (Europe -1.9 percent) which means six consecutive positive quarters. This has only happened eight times before and only on one of the (eight) occasions has the following quarter yielded a negative return. Two quarters later, it has in all cases yielded a positive return. In addition, for the past 20 years, October has been the fourth best month, thus much better than its reputation. Having pointed that out, October takes first place in terms of most frequent daily movements that exceed one percent.
The Stockholm Stock Exchange, which is an excellent reference point, had risen by 30 percent at its highest about a month ago, but is currently at 20 percent. Even more important is that measured in USD, OMX has "only" risen by 13 percent, which is in line with the US stock markets. This is hardly excessive given the profit growth among the companies. The risk premium in the market is high.
Investors are reasonably careless, and we are approaching the turn of the year. Global growth is well above average and interest rates are extremely low. Given how cruel the market has been to many investors this year, with sector rotations and a high concentration of companies driving performance, it almost feels obvious that the broad mass of investors will continue to reduce risk in their portfolios and then be short equities at year-end when the market rises. We'll see, but that's our main scenario right now.

We are now closing the books for the third quarter, and we look forward to the end of the year and above all the entrance for Truecaller on the Stockholm Stock Exchange on October 8!
Thank you for this month and we'll hear from you later.
Mikael & Team
Malmö on 5 October
[/et_pb_text][et_pb_text admin_label="Coeli Nordic Corporate Bond Fund R-SEK" _builder_version="3.0.89" background_layout="light" module_class="gen-table-module" disabled_on="on|on|on" disabled="on"]
Coeli Nordic Corporate Bond Fund
| Performance in Share Class Currency | 1 Mth | YTD | 3 yrs | Since incep |
| Coeli Nordic Corporate Bond Fund - R SEK | 1.30% | -0.93% | 3.38% | 14.52% |
| | | | |
[/et_pb_text][et_pb_text admin_label="Coeli Nordic Corporate Bond Fund R-SEK" _builder_version="3.0.89" background_layout="light" module_class="gen-table-module" disabled_on="on|on|on" disabled="on"]
[cg_linear_graph id="31122"]
[/et_pb_text][et_pb_image _builder_version="3.0.89" src="https://coeli.com/wp-content/uploads//2020/10/ncbr.png" show_in_lightbox="off" url_new_window="off" use_overlay="off" always_center_on_mobile="on" force_fullwidth="off" show_bottom_space="on" disabled_on="on|on|on" disabled="on" /][/et_pb_column][et_pb_column type="1_3"][et_pb_image _builder_version="3.0.89" src="https://coeli.com/wp-content/uploads/2019/01/Gustav-Fransson6.jpg" show_in_lightbox="off" url_new_window="off" use_overlay="off" always_center_on_mobile="on" force_fullwidth="off" show_bottom_space="on" custom_margin="||21px|" disabled_on="on|on|on" disabled="on" /][et_pb_text admin_label="Namn och title" _builder_version="3.0.89" background_layout="light" module_class="gen-single-ingress-module" custom_margin="||40px|" disabled_on="on|on|on" disabled="on"]
Gustav Fransson
Portfolio Manager of Coeli Nordic Corporate Bond Fund
[/et_pb_text][et_pb_image _builder_version="3.0.89" src="https://coeli.com/wp-content/uploads/2018/10/Alexander-Larsson-Vahlman.jpg" show_in_lightbox="off" url_new_window="off" use_overlay="off" always_center_on_mobile="on" force_fullwidth="off" show_bottom_space="on" custom_margin="||21px|" disabled_on="on|on|on" disabled="on" /][et_pb_text admin_label="Namn och title" _builder_version="3.0.89" background_layout="light" module_class="gen-single-ingress-module" custom_margin="||40px|" disabled_on="on|on|on" disabled="on"]
Alexander Wahlman
Senior Analyst
[/et_pb_text][et_pb_text admin_label="Fund Overview" _builder_version="3.0.89" background_layout="light" custom_margin="||20px|" module_class="gen-trustee-single-table"]
Fund Overview
| Inception Date | 2017-12-20 |
| Investment management fee (share class I SEK) | 1.00% p.a + 20% Performance fee (OMRX T-Bill Index) |
| Performance Fee. Yes | 20% |
| Risk category | 5 of 7 |
[/et_pb_text][et_pb_text admin_label="Top Holdings (%)" _builder_version="3.0.89" background_layout="light" custom_margin="||20px|" module_class="gen-trustee-single-table" disabled_on="on|on|on" disabled="on"]
Top Holdings (%)
| LANSBK 1.25% 18-17.09.25 | 4.1% |
| NORDEA HYP 1.0% 19-17.09.25 | 4.1% |
| SWEDBK 1.0% 19-18.06.25 | 4.1% |
| WHITE MOUNT FRN 17-22.09.47 | 3.9% |
| B2 HOLDING FRN 19-28.05.24 | 2.9% |
[/et_pb_text][/et_pb_column][/et_pb_row][/et_pb_section][et_pb_section bb_built="1" fullwidth="off" specialty="off" _builder_version="3.0.89" module_class="gen-trustee-single-yield-section gen-pattern-section" custom_padding="0px|||"][et_pb_row _builder_version="3.0.89" custom_padding="||53px|"][et_pb_column type="4_4"][et_pb_text admin_label="VIKTIG INFORMATION" _builder_version="3.0.89" background_layout="light" module_class="gen-trustee-single-warning-blurb"]
IMPORTANT INFORMATION. This is a marketing communication.
Before making any final investment decisions, please refer to the prospectus of Coeli SICAV II, its Annual Report, and the PRIIP of the relevant Sub-Fund. Relevant information documents are available in English at coeli.com. A summary of investor rights will be available at
https://coeli.com/regulatory-information-coeli-asset-management-ab/.
Past performance is not a guarantee of future returns. The price of the investment may go up or down and an investor may not get back the amount originally invested.
[/et_pb_text][/et_pb_column][/et_pb_row][/et_pb_section]