[et_pb_section bb_built="1" fullwidth="off" specialty="off" _builder_version="3.0.89" background_image="https://coeli.com/wp-content/uploads//2023/03/Coeli-Renewable-Opportunities_head_fm.jpg" parallax="on" module_class="gen-trustee-single-hero"][et_pb_row][et_pb_column type="4_4"][/et_pb_column][/et_pb_row][/et_pb_section][et_pb_section bb_built="1" fullwidth="off" specialty="off" _builder_version="3.0.89" custom_padding="0px||0px|"][et_pb_row][et_pb_column type="4_4"][/et_pb_column][/et_pb_row][et_pb_row _builder_version="3.0.89" background_position="top_left" background_repeat="repeat" background_size="initial" custom_padding="0px|||" custom_padding_phone="23px|||" custom_padding_last_edited="on|tablet" module_class_2="gen-trustee-single-sidebar" module_class="gen-single-news-content-row "][et_pb_column type="4_4"][et_pb_text admin_label="Tillbaka-knapp" _builder_version="3.0.89" background_layout="light" border_style="solid" custom_margin_tablet="||17px|" custom_margin_last_edited="on|desktop" module_class="gen-back-button hide-in-print" border_style_all="solid"]
Before making any final investment decisions, please read the prospectus, its Annual Report, and the PRIIP of the relevant Sub-Fund here
[/et_pb_text][et_pb_text admin_label="Tillbaka-knapp" _builder_version="3.0.89" background_layout="light" border_style="solid" custom_margin_tablet="||17px|" custom_margin_last_edited="on|desktop" module_class="gen-back-button hide-in-print" border_style_all="solid"]
This material is marketing communication
[/et_pb_text][et_pb_text admin_label="Datum / Skriv ut" _builder_version="3.0.89" background_layout="light" border_style="solid" custom_margin_tablet="||17px|" custom_margin_last_edited="on|desktop" module_class="gen-single-news-date-module gen-trustee-print-module hide-in-print" locked="on" border_style_all="solid"]
[blog_post_date]
Print
[/et_pb_text][et_pb_text _builder_version="3.0.89" background_layout="light"]
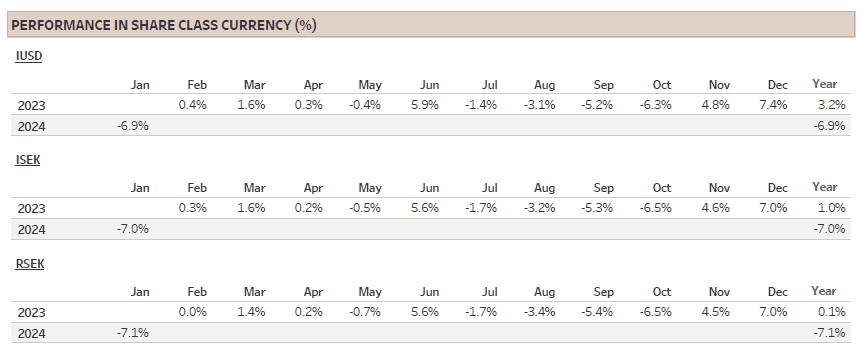
Coeli Renewable Opportunities Monthly Report January 2024 (I USD)
1) Share Class I USD
Performance for other share classes towards the end of the report.
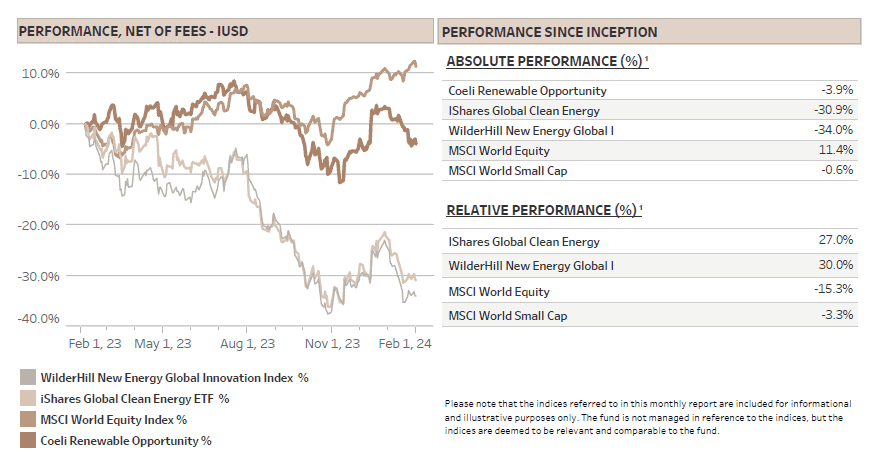
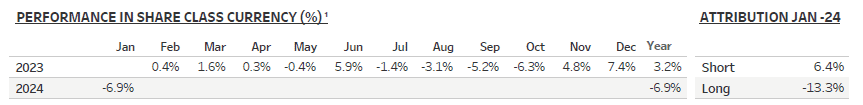
The Coeli Renewable Opportunity fund lost 6.9% net of fees and expenses in January (I USD share class). It is down 3.9% since the inception on February 6, 2023.
Despite the weak start to the year, the fund outperformed the two most comparable indices, the Wilderhill New Energy Global index (NEX) and the iShares Global Clean Energy (ICLN) by 6.5% and 4.4% in January. Since inception, the outperformance is 30% and 27%, respectively.
There were several reasons for the poor performance of the renewable energy equities in January. First, the sector had a great run in November and December and was due some profit-taking. Second, a key driver for the yearend rally was the sharp fall in long term rates triggered by expectations of a FED cut in March followed by four to five more reductions the next 12 months. However, long term rates rose in early January as optimism on cuts was wound back and renewable energy duly underperformed. Finally, Europe’s fossil-linked power prices, which had been declining through November and December, took another leg down in January. This can be explained by the warm winter, the seasonally full gas storage and the lack of industrial demand pick up in Europe and China. However, we were surprised that forward price for 2025 and 2026 decreased even more than 2024 prices, suggesting underlying dynamics that warrant a more in-depth analysis.
Moreover, while we expected some earnings downgrades for the developers from unhedged merchant power prices, we were taken aback by the profit warning from RWE. Earnings impact on flexible generation were clearly more impacted than we and the market had anticipated. With a strong readthrough to RWE’s peers, our two renewable development themes were among the worst performers in January.
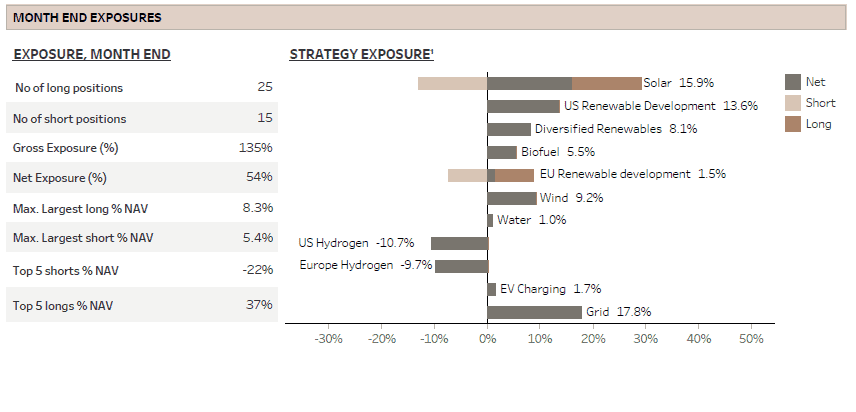
Long positions lost 13.3% of NAV in January, but the overall pain was eased by shorts gaining 6.4%. We reduced net exposure to 54% at the month-end as we became increasingly concerned about forward power prices and acknowledged the less optimistic expectations for FED cuts. The fund has a variable net exposure but operate with a sweet spot in the 40-80% range.
MARKET COMMENT – FROM SOFT LANDING TO NO LANDING?
Despite the reduced optimism on an early FED cut, the S&P 500 rose by 1.6% in January and set a new all-time high. The rally was narrow though and mainly driven by Megacap and other technology companies while the equal weighted S&P was down 1%. The Russel 2000 Index, representing small caps, fell by 4% and the key renewable energy indices did even worse ranging from a decline of 11% to 21%, proving their higher interest rate sensitivity.
The month ended with a FED meeting where Chairman Powell stated that a March rate cut was unlikely. Following strong job data in early February, the bond market has practically removed the chance of a March cut and see only a 60% chance of a rate reduction in May. The market is at the time of writing expecting four cuts this year versus five at the beginning of January.
The economic activity is simply better than most pundits had expected, and the talk has again changed from ‘soft vs hard landing’ to ‘soft landing vs no landing’. This means the FED has more time to gauge that inflation is really coming down to target and it can reduce the risk of a too early cut triggering a re-acceleration of inflation. On the other hand, an interesting recent development was Governor Bostic confirming the FEDs new view of the NAIRU (Non-accelerating inflation rate of unemployment) to be significantly lower than in the past. This implies that the unemployment rate does not need to rise materially from the current level to support the probability of rate cuts.
Although the deferred interest rate reductions hurt share prices in our universe in the short term, we would rather see delayed rate cuts and no economic slowdown than rapid cuts due to a recession. In the end, as long as the cutting cycle commences this year and inflation gets close to the 2% target, we continue to believe that renewable energy equities will do well in 2024.
THE UNEXPECTED DOWNWAD TREND IN EUROPEAN POWER PRICES
In 2022 when Russia attacked Ukraine, the global economy was shaken by a severe power price shock as energy costs soared to a staggering 12% of global GDP. In the wake of diminished gas supplies from Russia, the crisis set the stage for an ongoing debate about the future of energy prices, particularly in Europe. As Europe secured its own energy supply by bidding up the global price of LNG (Liquefied Natural Gas), it left emerging markets in a difficult position.
These countries, led by China, India and Indonesia responded in a natural yet impactful way by substantially increasing coal production. This move reversed the prior trend of stable to declining global coal demand. The International Energy Agency's (IEA) 2018 prediction of 7.6Gtpa global coal demand for 2023 fell short, as the actual figure is almost 15% higher. This surge resulted in an additional 2 billion tons of annual Green House Gas emissions, more than a 3% increase on the total annual emissions, a dire outcome for the climate.
The increased coal production in Asia is clearly one of many reasons for the sharp drop in forward power prices in Europe and Germany over the last months, which accelerated in January. This development warrants a deeper analysis.
Since mid-October, the German baseload electricity price 12- and 24-months forward are both down more than 35%, with about 70% of the decline in January. Although this is great news for European industry and the global fight against inflation, it could have a negative impact on certain subsector in the renewable energy space. An emerging worry in the financial markets is that the lower power prices will impact Power Purchase Agreement (PPA) prices as they are in effect long term contracts to purchase power.
But first, why are power prices falling? Power prices in Europe are largely a function of gas price and carbon prices, but as the latter tend to follow the gas price on the way down, the culprit is mainly the gas price. Why are both the spot and the 12-month forward gas price down by almost 50% and 24-month forward about 30% lower than in mid-October?
On the demand side, the mild winter plays a significant role combined with reduced European industrial demand, which is still lagging 15-20% below pre-energy crisis levels. Last years’ high residential energy bills also appear to have had an impact on consumer habits as demand is down more than what can be explained by the temperature. According to EMBER, an energy think tank, weather adjusted power demand in the EU 27 is down as much as 7% since 2021.
On the supply side, as described above, there has been a global increase in coal consumption facilitating the higher imports of LNG to Europe. There is also more piped gas from Norway and North Africa, while demand for gas for power production is reduced as supply of nuclear and hydro energy is up significantly since 2021/22. In addition, solar and wind capacity is added every year helping to reduce the need to burn gas for power. In total, gas demand for power production was 17% lower in H2/23 than in H2/22, according to EMBER. This is good news for Europe’s carbon footprint.
However, considering this supply/demand situation and the fact that European gas inventories were at full capacity last autumn, it is not surprising that inventories in early February is almost 70% full vs historical average in the low to mid 50% range. Moreover, assuming normal temperatures over the next months, there is a significant risk of tank tops, i.e. full storage, during the summer. In the few instances this has happened in the past, the price can briefly trade below EUR 10MWh versus almost EUR 30MWh today. Power prices correlates strongly with gas prices on the way down, so this would be a headwind for companies with limited fixed price contracts or hedges.
The above scenario is something we have been aware of for several quarters, but what has taken us by surprise is the even sharper fall in the forward power prices. The market seems to be willing to price in not only a mild winter next year, but also no significant improvement in demand for power. Demand is fundamentally difficult to forecast as it is driven by many factors, including the price level.
Although the supply side is also complicated, it seems likely that the global LNG markets will be well supplied the next three to four years. The two largest LNG exporters, the US and Qatar, are ramping their export capacity by 100% and 50%, respectively over the next years, see below.
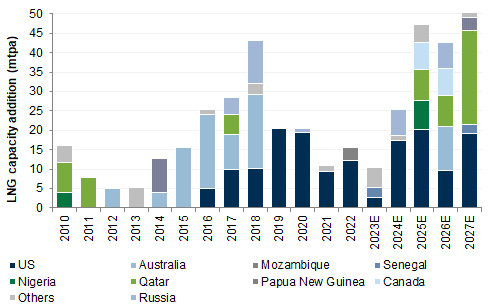 Source: Goldman Sachs
The new LNG export capacity is in fact larger in size than the Russian piped gas that has been shut in. The Russian gas accounted for about 40% of Europe’s gas consumption before the war. Since European power prices are almost back to pre-war levels, the Russian gas has basically been replaced by alternative energy sources; LNG, piped gas, coal burning in Asia, new renewable energy and importantly, reduced demand from industry and households in Europe and Asia.
At first glance, it looks like we are set up for oversupply and low gas and power prices for years to come. However, it is important to have in mind that as gas prices fall, coal to gas switching will occur. Also, when power prices decline, demand will surely pick up helping to balance the market. As always in commodity markets, low prices alleviate low prices, just like the high prices of the energy crisis was cured by triggering more supply and reducing demand.
What is the impact on the PPA prices and the implication for renewable developers? PPA prices have a floor which is roughly the price at which developers make a return. This threshold is driven by capex, cost of financing and cost of capital. The PPA cannot be set below the floor as the developer would be destroying value. However, PPAs above the threshold are correlating with power prices as developers will try to maximize returns, taking advantage of arbitrage between market prices and PPA prices. On the margin, lower and most importantly declining PPA prices have, everything else equal, a negative impact on the developers. This was rapidly priced into the share prices in January, though.
Nevertheless, there are additional factors to consider. First, input costs for solar panels have halved in Europe and there is potential for lower financing costs in the near future. This could lead to attractive returns even at reduced PPA prices. Second, most renewable development projects take years from planning starts to production commences. This means basing investments decisions on volatile forward prices might be unwise unless you can lock in these prices, which is difficult for large buyers in need of 15-20 years agreements. Third, there has been and still is a large group of price agnostic buyers willing to purchase PPAs at rates well above spot and forward power prices. This segment is likely expanding, with a notable example being the owners of generative AI server farms. These servers consume approximately 4 to 20 times more electricity than traditional cloud servers, and demand forecasts keep being revised higher at a very rapid pace. Finally, if PPA prices fall to levels that are not economically viable, governmental intervention may become necessary to achieve specific climate goals. This approach has been and continues to be a key factor in the development of for example offshore wind projects.
All in all, although we and the market were taken by surprise by the sharp fall in power prices in January, we believe this development creates interesting opportunities on both the long and short side and we see several interesting ways to profit.
FUND PERFORMANCE – CHALLENGING MONTH IN RENEWABLES
The fund lost 6.9% (I USD) in January, its worst month to date as all but the two hydrogen themes and the ‘Grid’ theme were down on the month. As already mentioned, the renewable indices fell by 11% to 21% in January, driven down by a reversal in rate expectations and profit taking after a strong performance during the last two months of 2023.
The renewable energy developers in Europe were also hit by lower power prices. The ‘EU Renewable development’ theme lost 1.6% of NAV, pulled down by
RWE and
EDPR which declined by 17% and 19%, respectively. The stocks were already significantly down when
RWE towards the end of the month warned that 2024 profit was likely to come in at the low end of the guidance range it published only two months earlier. Although it was widely expected that the decline in power prices would hurt earnings on unhedged renewable energy production (the consensus for
RWE was a 4-5% hit to 2024 earnings per EUR 10MWh decline in power prices), the profit warning indicates that the impact on flexible generation, i.e. electricity generation from gas, coal, hydro and biomass, will be much more substantial than the hit to unhedged renewable power sales. This surprised us, most analysts and judging from the share price reaction, many on the buy-side.
Although we believe
RWE’s management is prudent in its guidance, we have reduced the net exposure to renewable developers by both cutting long positions and adding shorts that will be hurt even more than
RWE if power prices should test new lows this year.
The worst performing theme of the month, losing 3.1% of NAV, was not unexpectedly the ‘Solar’ theme. It has the largest gross capital allocation, and it is still skewed net long, though less than in the past. The TAN Index, the Invesco Solar ETF, declined as much as 21% during January on no specific industry news. As the index has almost unwound all the gains from November and December (+27%), we believe sentiment and positioning are again the main drivers, but closing in on October lows, the sector could be about to bottom.
At least there were some positive news on the last day of the month.
Nextracker (NXT), the global leader in solar tracking systems, reported very strong quarterly results and increased the guidance for the third quarter in a row.
NXT presented an optimistic view to the market and quoted an industry growth expectation of 26% annually over the next 5 years. Sell-side consensus agreed and is currently expecting almost 50% higher revenues for
NXT in FY 2027 than in FY 2024. Although it is obvious that
NXT is winning significant share from among others
Array Technologies (
ARRY), a company that we own, it is unreasonable to assume that
NXT’s strong growth is solely from market share gains. We believe the growth in the utility-scale market is likely to surpass the current consensus, which expects only high single-digit increases. Satellite tracking sources point to a potential of 70% growth in 2024. Although many of these projects have already sourced trackers sold by
NXT and
ARRY, we believe it implies upside to current consensus.
Although we admit having bet on the wrong utility scale company, at least so far, we believe there is upside in the
ARRY stock as the market is expecting earnings to come in well below the sell-side consensus. The company also has substantial orders pending the clarification of the IRA’s domestic content rules, and it is screens inexpensive on 2025 earnings expectations. Finally, the stock has given up all the gains from November and December and is again heavily shorted, which we believe could trigger a rally even on mediocre quarterly results.
At least that is what happened to
Enphase (ENPH) in the first week of February. The stock rose 17% after reporting weaker than expected Q4 results combined with lowered Q1 guidance and a delayed normalization in revenues. Although short interest was large heading into earnings, the management team also talked convincingly about the residential market bottoming in both the US and Europe one of the next quarters. As most pundits know, it is often late to buy these stocks after earnings have bottomed.
The third worst performing theme was ‘Diversified Renewables’ which deducted 1.4% from NAV. This theme only contains one long position,
Chart Industries (GTLS), which is one of our largest positions and we have written extensively about it in several previous monthly reports. The stock fell almost 15% in January, virtually all of it in the last week as news broke that the Biden administration would put a moratorium on further LNG export licenses from the US. As usual, the market shoots first and ask questions later.
First, LNG is an important business line for
Chart, so the headline reads bad. However, the moratorium only applies to new projects. i.e. already permitted projects are allowed to continue. The pipeline of LNG projects we showed earlier in the report is thus safe. Second,
Chart put out a press release reiterating its medium-term financial targets through 2026 and stating that it had not included any Big LNG projects in these targets.
Third, the moratorium is conveniently expected to last until after the election in November proving ample time to assess the claim that the carbon footprint of LNG is in fact higher than coal. If this is really the case, we would strongly support halting all new LNG export projects. However, if the assertion is not confirmed, we expect the moratorium to be lifted even if Biden wins a second term. If Donald Trump should win the election, we suspect export licenses would be granted even if the carbon footprint is as high as asserted by some environmentalists. Finally, Chart is a global supplier of LNG equipment and if there is a ban on further LNG export terminals in the US, there will be other regions of the world willing to provide LNG, granted that the economic prospects are sufficiently attractive. We believe that could maybe be a more important hurdle.
Chart is reporting Q4 earnings at the end of this month. The expectation is that it will lower its 2024 EBITDA target, which is already reflected in consensus that is 15% below. Our focus will be on free cash flow generation, and we expect fewer one-off adjustments as the Howden integration should have moved to a new level.
The only two themes with significant positive contribution in January was ‘US Hydrogen’, which added 1.8% to the NAV, and ‘EU Hydrogen’ which contributed 0.6% despite a short squeeze of more than 30% in one of our short positions. This stock has already given up all its gains and then some this month, though. We continue to be skeptical to the long-term demand outlook for hydrogen and our view is supported by the dearth of large orders the last 2-3 quarters.
Sincerely
Vidar Kalvoy & Joel Etzler
[/et_pb_text][et_pb_team_member _builder_version="3.0.89" name="Joel Etzler" background_layout="light" header_level="h6" position="Portfolio Manager, Coeli Renewable Opportunities" disabled_on="on|on|on" disabled="on" /][et_pb_team_member _builder_version="3.0.89" name="Vidar Kalvoy" background_layout="light" header_level="h6" position="Portfolio Manager, Coeli Renewable Opportunities" disabled_on="on|on|on" disabled="on" /][et_pb_post_title _builder_version="3.0.89" title="on" meta="off" author="off" date="off" categories="off" comments="off" featured_image="off" featured_placement="below" text_color="dark" text_background="off" border_style="solid" module_class="gen-single-news-heading-module gen-trustee-single-headline" date_format="d M, Y" border_style_all="solid" disabled_on="on|on|on" disabled="on" /][et_pb_text admin_label="Coeli Nordic Corporate Bond Fund R-SEK" _builder_version="3.0.89" background_layout="light" module_class="gen-table-module" disabled_on="on|on|on" disabled="on"]
Coeli Nordic Corporate Bond Fund
| Performance in Share Class Currency | 1 Mth | YTD | 3 yrs | Since incep |
| Coeli Nordic Corporate Bond Fund - R SEK | 1.30% | -0.93% | 3.38% | 14.52% |
| | | | |
[/et_pb_text][et_pb_text admin_label="Coeli Nordic Corporate Bond Fund R-SEK" _builder_version="3.0.89" background_layout="light" module_class="gen-table-module" disabled_on="on|on|on" disabled="on"]
[cg_linear_graph id="31122"]
[/et_pb_text][et_pb_image _builder_version="3.0.89" src="https://coeli.com/wp-content/uploads//2020/10/ncbr.png" show_in_lightbox="off" url_new_window="off" use_overlay="off" always_center_on_mobile="on" force_fullwidth="off" show_bottom_space="on" disabled_on="on|on|on" disabled="on" /][et_pb_image _builder_version="3.0.89" src="https://coeli.com/wp-content/uploads/2019/01/Gustav-Fransson6.jpg" show_in_lightbox="off" url_new_window="off" use_overlay="off" always_center_on_mobile="on" force_fullwidth="off" show_bottom_space="on" custom_margin="||21px|" disabled_on="on|on|on" disabled="on" /][et_pb_text admin_label="Namn och title" _builder_version="3.0.89" background_layout="light" module_class="gen-single-ingress-module" custom_margin="||40px|" disabled_on="on|on|on" disabled="on"]
Gustav Fransson
Portfolio Manager of Coeli Nordic Corporate Bond Fund
[/et_pb_text][et_pb_image _builder_version="3.0.89" src="https://coeli.com/wp-content/uploads/2018/10/Alexander-Larsson-Vahlman.jpg" show_in_lightbox="off" url_new_window="off" use_overlay="off" always_center_on_mobile="on" force_fullwidth="off" show_bottom_space="on" custom_margin="||21px|" disabled_on="on|on|on" disabled="on" /][et_pb_text admin_label="Namn och title" _builder_version="3.0.89" background_layout="light" module_class="gen-single-ingress-module" custom_margin="||40px|" disabled_on="on|on|on" disabled="on"]
Alexander Wahlman
Senior Analyst
[/et_pb_text][et_pb_text admin_label="Top Holdings (%)" _builder_version="3.0.89" background_layout="light" custom_margin="||20px|" module_class="gen-trustee-single-table" disabled_on="on|on|on" disabled="on"]
Top Holdings (%)
| LANSBK 1.25% 18-17.09.25 | 4.1% |
| NORDEA HYP 1.0% 19-17.09.25 | 4.1% |
| SWEDBK 1.0% 19-18.06.25 | 4.1% |
| WHITE MOUNT FRN 17-22.09.47 | 3.9% |
| B2 HOLDING FRN 19-28.05.24 | 2.9% |
[/et_pb_text][/et_pb_column][/et_pb_row][et_pb_row _builder_version="3.0.89" custom_padding="23px||23px|" custom_padding_last_edited="on|phone" box_shadow_position="outer" use_custom_gutter="on" gutter_width="4" custom_padding_tablet="0px||0px|" module_class="gen-pop-up-row gen-wide-sidebar-content-row gen-kapitalforvaltare-row" disabled_on="on|on|on" disabled="on"][et_pb_column type="1_3"][et_pb_blurb admin_label="Joel" _builder_version="3.0.89" url_new_window="off" use_icon="off" use_circle="off" use_circle_border="off" icon_placement="top" use_icon_font_size="off" background_layout="light" border_style="solid" image="https://coeli.se/wp-content/uploads/2019/08/Joel-Etzler-1.jpg" animation="off" text_orientation="center" header_text_align="center" body_text_align="center" alt="Fondförvaltare Joel Etzler" border_style_all="solid"]
Joel
[/et_pb_blurb][et_pb_text admin_label="Text / LinkedIn" _builder_version="3.0.89" background_layout="light" border_style="solid" module_class="gen-linked-in-module" border_style_all="solid"]
Joel Etzler
Portfolio Manager Coeli Renewable Opportunities
[/et_pb_text][et_pb_text admin_label="Popup" _builder_version="3.0.89" background_layout="light" border_style="solid" module_class="gen-pop-up-module" border_style_all="solid" disabled_on="on|on|on" disabled="on"]
Christofer Halldin
Fondförvaltare Coeli Circulus
Christofer förvaltar Coeli Circulus sedan starten augusti 2022. Innan det arbetade han som chef för den aktiva aktie- & ränteförvaltningen hos Handelsbanken (HB) Fonder. Där var han med och utvecklade Handelsbanken Fonder till en av Sveriges mest framgångsrika aktie- och ränteförvaltare under slutet av 2010-talet, då HB Fonder hade störst nettoinflöden på den svenska fondmarknaden flera år i rad. HB Fonder utsågs även under den tiden till både årets förvaltare och årets hållbara förvaltare av aktörer som Prospera, Privata Affärer, Söderberg & Partner, Länsförsäkringar m fl. Innan Christofer utsågs till chef för den aktiva förvaltningen förvaltade han under flera år olika globalmandat. Han har också arbetat sju år, 2007-2013, som förvaltare i USA av både Amerika-, Brasilien- och Latinamerikafonden på HB Fonder.➜ Kontakt:christofer.halldin@coeli.se➜ LinkedIn➜ Twitter➜ Instagram
[/et_pb_text][/et_pb_column][et_pb_column type="1_3"][et_pb_blurb admin_label="Vidar" _builder_version="3.0.89" url_new_window="off" use_icon="off" use_circle="off" use_circle_border="off" icon_placement="top" use_icon_font_size="off" background_layout="light" border_style="solid" image="https://coeli.se/wp-content/uploads/2019/10/Vidar-Kalvoy.jpg" animation="off" text_orientation="center" header_text_align="center" body_text_align="center" alt="Portfolio Manager Vidar Kalvoy" border_style_all="solid"]
Vidar
[/et_pb_blurb][et_pb_text admin_label="Text / LinkedIn" _builder_version="3.0.89" background_layout="light" border_style="solid" module_class="gen-linked-in-module" border_style_all="solid"]
Vidar Kalvoy
Portfolio Manager Coeli Renewable Opportunities
[/et_pb_text][et_pb_text admin_label="Popup" _builder_version="3.0.89" background_layout="light" border_style="solid" module_class="gen-pop-up-module" border_style_all="solid" disabled_on="on|on|on" disabled="on"]
Joakim By
Fondförvaltare Coeli Circulus
Joakim förvaltar Coeli Circulus sedan starten augusti 2022. Innan det arbetade han som förvaltare av Amerika Småbolag hos Handelsbanken Fonder. Han förvaltade Amerika Småbolag från 2015 och vann flera utmärkelser för den goda avkastningen i fonden som också växte kraftigt under hans tid som förvaltare. När Joakim lämnade fonden i början på 2022 hade den över 20 miljarder kronor i förvaltat kapital. Innan han förvaltade Amerika Småbolag ansvarade han bland annat för den bredare fonden Amerika Tema, 2013-2017, och globalfonden Global Tema, 2009-2013, hos Handelsbanken Fonder.➜ Kontakt: joakim.by@coeli.se➜ LinkedIn➜ Twitter➜ Instagram
[/et_pb_text][/et_pb_column][et_pb_column type="1_3"][/et_pb_column][/et_pb_row][et_pb_row _builder_version="3.0.89" custom_padding="23px||23px|" custom_padding_last_edited="on|phone" box_shadow_position="outer" use_custom_gutter="on" gutter_width="4" custom_padding_tablet="0px||0px|" module_class="gen-pop-up-row gen-wide-sidebar-content-row gen-kapitalforvaltare-row" disabled_on="off|off|off" disabled="off"][et_pb_column type="1_2"][et_pb_blurb admin_label="Joel" _builder_version="3.0.89" url_new_window="off" use_icon="off" use_circle="off" use_circle_border="off" icon_placement="top" use_icon_font_size="off" background_layout="light" border_style="solid" image="https://coeli.com/wp-content/uploads/2024/01/Joel1.jpg" animation="off" text_orientation="center" header_text_align="center" body_text_align="center" alt="Fondförvaltare Joel Etzler" border_style_all="solid"]
Joel
[/et_pb_blurb][et_pb_text admin_label="Text / LinkedIn" _builder_version="3.0.89" background_layout="light" border_style="solid" module_class="gen-linked-in-module" border_style_all="solid"]
Joel Etzler
Portfolio Manager Coeli Renewable Opportunities
[/et_pb_text][et_pb_text admin_label="Popup" _builder_version="3.0.89" background_layout="light" border_style="solid" module_class="gen-pop-up-module" disabled_on="off|off|off" disabled="off" border_style_all="solid"]
Joel Etzler
Portfolio Manager Coeli Renewable Opportunities
- Portfolio Manager Coeli Renewable Opportunities
- Joined Coeli in 2019
- More than 13 years of experience from the financial industry
- MSc from the Royal Institute of Technology
Joel Etzler is Portfolio Manager and Founder of the Coeli Renewable Opportunities fund and has more than 13 years in the industry, with investment experience from both the public and private equity side. Etzler joined Kalvoy at Horizon Asset in London in 2012 and spent five years before that within Private Equity at Morgan Stanley. Etzler started his investment career within the technology sector at Swedbank Robur in Stockholm, 2006.
[/et_pb_text][/et_pb_column][et_pb_column type="1_2"][et_pb_blurb admin_label="Vidar" _builder_version="3.0.89" url_new_window="off" use_icon="off" use_circle="off" use_circle_border="off" icon_placement="top" use_icon_font_size="off" background_layout="light" border_style="solid" image="https://coeli.com/wp-content/uploads/2024/01/Vidar-Kalvoy-1.jpg" animation="off" text_orientation="center" header_text_align="center" body_text_align="center" alt="Portfolio Manager Vidar Kalvoy" border_style_all="solid"]
Vidar
[/et_pb_blurb][et_pb_text admin_label="Text / LinkedIn" _builder_version="3.0.89" background_layout="light" border_style="solid" module_class="gen-linked-in-module" border_style_all="solid"]
Vidar Kalvoy
Portfolio Manager Coeli Renewable Opportunities
[/et_pb_text][et_pb_text admin_label="Popup" _builder_version="3.0.89" background_layout="light" border_style="solid" module_class="gen-pop-up-module" disabled_on="off|off|off" disabled="off" border_style_all="solid"]
Vidar Kalvoy
Portfolio Manager Coeli Renewable Opportunities
- Portfolio Manager Coeli Renewable Opportunities
- Joined Coeli in 2019
- 25 years of experience from the financial industry
- MBA from IESE, MSc from Norwegian School of Economics and Business Adm.
Vidar Kalvoy is the lead Portfolio Manager and Founder of Coeli Renewable Opportunities fund. He has 25 years of experience from portfolio management and equity research. For nine years he was responsible for the energy investments at Horizon Asset in London, a market neutral hedge fund. Kalvoy also did energy investments at MKM Longboat, another hedge fund in London. He started his financial career as a sell side equity research analyst focusing on the technology and telecom sector, working six years in Oslo and Frankfurt. Prior to working in finance, he was a second lieutenant in the Norwegian Navy.
[/et_pb_text][/et_pb_column][/et_pb_row][et_pb_row _builder_version="3.0.89" background_position="top_left" background_repeat="repeat" background_size="initial" module_class="gen-single-news-content-row gen-trustee-single-content-row" custom_padding="0px|||" custom_padding_phone="23px|||" custom_padding_last_edited="on|tablet" module_class_2="gen-trustee-single-sidebar" disabled_on="on|on|on" disabled="on"][et_pb_column type="2_3"][et_pb_text admin_label="Tillbaka-knapp" _builder_version="3.0.89" background_layout="light" border_style="solid" custom_margin_tablet="||17px|" custom_margin_last_edited="on|desktop" module_class="gen-back-button hide-in-print" border_style_all="solid"]
Note that the information below describes the share class (I SEK), which is a share class reserved for institutional investors. Investments in other share classes generally have other conditions regarding, among other things, fees, which affects the share class' return. The information below regarding returns therefore differs from the returns in other share classes.
Return to Fund page
[/et_pb_text][et_pb_text admin_label="Datum / Skriv ut" _builder_version="3.0.89" background_layout="light" border_style="solid" custom_margin_tablet="||17px|" custom_margin_last_edited="on|desktop" module_class="gen-single-news-date-module gen-trustee-print-module hide-in-print" locked="on" border_style_all="solid"]
[blog_post_date]
Print
[/et_pb_text][et_pb_post_title _builder_version="3.0.89" title="on" meta="off" author="off" date="off" categories="off" comments="off" featured_image="off" featured_placement="below" text_color="dark" text_background="off" border_style="solid" module_class="gen-single-news-heading-module gen-trustee-single-headline" date_format="d M, Y" border_style_all="solid" /][et_pb_text _builder_version="3.0.89" background_layout="light"]
Utveckling september
Fondens värde sjönk -5,1 procent i september (andelsklass I SEK). Stoxx600 (brett Europaindex) sjönk under samma period med -3,4 procent och HedgeNordics NHX Equities var preliminärt oförändrat. Motsvarande siffror för 2021 är en ökning om +21,6 procent för fonden, +14,0 procent för Stoxx600 och +6,4 procent för NHX Equities.


Equity markets / Macro environment
After seven consecutive months of positive performance the world’s stock markets were poised for some degree of turbulence. Volatility was especially high in some equities and on Monday, September 20, the highest nominal volume ever traded was reached in options on the S&P500 (!) The broad European index fell by 3.4 percent in September compared to the S&P500 which fell by 4.8 percent. The fund also had its first negative performance since October last year with a decline of 5,1 percent. More about that later.
Despite high levels for many stock indices, sentiment among investors has been relatively gloomy. Bank of America's monthly survey recently showed that only 13 percent of managers expect a positive market in the future, which is the lowest figure since April 2020 (and that was clearly wrong). The reasons cited are China's growth problems, the crisis-stricken Chinese real estate giant Evergrande, the development of the delta variant, declining profit growth and, of course, rising inflation. However, they are still overweight equities which is perhaps not so strange when you have to pay to lend your capital to countries. As interest rates rose at the end of the month, the German 10-year interest rate followed with a giant step from - 0.25 percent to - 0.17 percent… The picture below is an overall risk indicator, and we are around zero (neutral).

The news flow in September began with record high inflation figures in Europe at +3.0 which exceeded market expectations. The corresponding figure in July was + 2.2 percent. It was the fastest growth rate since November 2011 and several countries recorded up to five percent in inflation rate. The pressure on the ECB to reduce its support measures is increasing. On Friday, October 1, new inflation figures came in for September, which showed a further acceleration in the inflation rate by +3.4 per cent.
The rate of change can be mostly attributed to rising energy prices that are starting to create real problems in the world's economies as well as agricultural shifts. The picture below shows that food prices are at record high levels over the past 60 years. The biggest losers are the poorest part of the population.

In the slightly longer term it is forecasted that it is not excessive demand that will drive inflation, but rather a limited supply, and then both in terms of products and labour. At the end of September, long queues were reported at petrol stations across the UK when fuel ran out and there were not enough truck drivers to refuel. Prime Minister Boris Johnson urges his citizens to refuel sensibly and at a normal rate. You wanted Brexit, so there you go. In sheer desperation, Johnson has now issued 5,000 temporary short-term visas for temporary drivers. Good luck.
M25 spring 2022?

Below are European gas prices which have risen in a seemingly uncontrolled fashion and recorded the highest September prices ever. A silent prayer for the mild winter. We guess that this development will soon be a major topic in the media, and it will undoubtedly create various problems and somewhat reduce next year's expected growth. It feels reassuring that Per Bolund (Swedish Green Party MP) claims that there is no electricity shortage in Sweden because then the costs for ordinary people would be unbearably high during the winter (which of course they will be). Rising gas and electricity prices have led European politicians to start discussing billion-dollar subsidies (in euros) to households and manufacturers who will experience sharply rising electricity bills over the winter.

Source: Bloomberg
Henrik Svensson, site manager at the oil-fired power plant in Karlshamn (south Sweden), does not agree with Per Bolund that we have a surplus of electricity in the country. For large parts of September, the power plant ran at full capacity and burned 240k liters of oil per hour. Henrik Svensson believes that it is electricity shortages and high electricity prices that are behind the high production. He also says that there is a lack of planned power production in southern Sweden and that it will take many years before the electricity grid is strengthened and new electricity production is in place. Sweden today burns more oil than we have done in 10 years. A gigantic energy policy and climate policy failure signed by the Green Party.

Source: Steget efter
Winning candidate for this year's Christmas presents below.

The change in the US 10-year interest rate created considerable pressure on, primarily, growth stocks at the end of the month. The performance dispersion for different sectors was very large in September with oil shares as a clear winner. This was also felt in the last days of September.

Source: Bloomberg
Below is the development for the US 10-year interest rate. The turbulence in the stock market was caused by the change in interest rate level breaking through on the upside, as can be seen in the chart.

There have been countless attempts to explain the turbulence in recent weeks. The recent and significant amount of options being exercised, Evergrande, interventions by the Chinese government, Fed tapering, Bank of England expected to raise interest rates, delta variant, inflation, bottlenecks in production, difficulties in finding staff, rising energy prices and declining growth rates. We think it is enough to look at the picture below. Rising interest rates hit hard at growth companies' valuations.

Goodbye Mutti and thank you for an extraordinary effort for Europe!

Source: Nyhetsbyrån TT
She was politically in a class of her own during the euro crisis ten years ago and Sweden also has her to thank for a lot. Despite a somewhat weaker performance in recent years, German citizens have experienced significantly better economic development than many others.

On September 29, the covid-19 restrictions in Sweden were finally removed and we can now, in principle, start living a normal life again. The number of bookings for winter holidays skyrocketed to the great joy of the tourist and transport industry. In recent months, tourism activity in the Mediterranean has been "extraordinary" and much better than forecasted before the summer. Luxury travel is also reaching new heights. Private jet passengers to Mallorca increased by +70 percent in July compared to July 2019 with an average of 83 private jets per day landing in Palma. If you want to rent a yacht, you are being referred to next year as basically everything has already been fully booked.
We now belong to a minority group. Passively managed capital exceeds actively managed capital for the first time ever. This will give us more opportunities as mispricing increases.

In addition to being one of the world's best stock markets this year, Sweden also has the most listed companies in the entire EU. Bloomberg drew attention to the fact that there are now around 1,000 listed companies on the various trading platforms in Stockholm. More than 80 percent are smaller companies, and the list is filled with new listings every day until Christmas! For us, it is interesting as we are constantly looking for new potential core holdings. In recent weeks, we have identified one which we write about under Long Positions.
We end this section with a picture that well reflects today's political level.

Source: Kluddniklas
Long positions
Truecaller
During September, we did a lot of work on the Swedish company Truecaller which will go public on October 8th. Truecaller is one of the most interesting companies we’ve seen in recent years. Truecaller has developed a phone application that can, among other things, identify unwanted calls from, for example, telemarketers. The app is one of the top ten most downloaded applications globally, and in some of the main markets such as India, Nigeria and Indonesia, it is one of the three most downloaded apps. As a Swedish company with headquarters in Stockholm, the firm has chosen to list on the Swedish stock exchange, which we are very happy about.
Truecaller was founded in 2009 by Alan Mamedi and Nami Zarringhalam. They met at the Royal Technical University in Stockholm, and they continue to be active in the company as the CEO and Chief Strategic Officer (CSO), respectively. When they released the first version of the app, they received 10,000 downloads within one week. By 2013 they had reached over 10 million users globally and in Q2 2021 they had reached 278 million monthly users. Throughout their journey, Truecaller has attracted several well-known investors such as Sequoia Capital (early investors in Apple, Whatsapp, and Zoom among others), Atomica (Skype-founder Niklas Zennström’s investment company), and Kleiner Perkins (early investors in Google, Amazon, and Spotify among others).

Until recently, revenue streams have mainly consisted of income from in-app advertising. In addition to this, there is a premium version where paying users can get additional functionalities. That business accounted for around 20 percent of revenues in 2020. During the fall of 2020, Truecaller launched a corresponding offering that targets corporates. This part of the business allows B2B customers to be listed as verified callers when they call private people. It can for example be a security company that calls about an alarm or a courier company that needs to get in contact with a receiving customer. It is a common problem that these types of companies get rejected when the call-receiver doesn’t recognize the number.
Truecaller declares that their product benefits from network effects. i.e., the product gets better the more people who use it (think Facebook). This can be relatively easy to appreciate since phone number identification inherently evolves from reporting of unwanted calls by the users, i.e., when enough people have reported an unwanted call Truecaller flags for this in the app). Over time, Truecaller has built a database containing 5.7 billion unique phone-identities. Network effects doesn’t just build a better product over time, they also increase the entry-barriers for potential competition.
The majority of Truecaller’s income comes from developing countries. The company explains that the problems related to spam emails, harassment, unwanted calls, and messages are more common there than in the western world. India is Truecaller’s largest market where these types of problems are significant. One positive aspect of the geographical exposure is that it allows for a nice structural tailwind: the population growth in developed markets is much higher than in the west (driven by an increasing average age) and the smartphone penetration is growing fast.
Historically, 97 percent of all app downloads have been organic. However, management has begun to experiment with user acquisitions by the way of advertisements through, for example, Facebook. The returns on user acquisition looks extremely attractive. In some markets, such as India, Truecaller could achieve a return on investment of up to 20x on every spent dollar. In more mature markets, such as the USA, the same multiple amounts to 4x, still very attractive. Indonesia, which is a relatively new market to the company, has a multiple of 0.8x. This means any user acquisition spend in Indonesia is unprofitable at this point. However, management is confident that the return profile will wander above the 1x as more users join and the network effects take place. In summary, the investment opportunities are plentiful and attractive – and unique.
In summary, several things speak for significant growth in the future. The investment in paid user acquisition, a sharpened premium-offer, the newly launched B2B product and continued growth of the advertising business. In addition to this, acquisitions may likely follow.
Growth has been prioritized over profitability and it is only recently that the company began to report profits. In 2019 sales grew by 57 percent. In 2020 the corresponding figure was 64 percent, and during the first half of 2021 the company’s sales grew with as much as 151 percent in comparison to the same period last year (which was partly affected by the pandemic). During the first half of this year, the company’s operating margin was 32 percent. As you can imagine, Truecaller is very capital-efficient. Working capital is very low which gives a nice cash conversion and a very high return on capital employed – all attributes that are required to create a very successful and valuable company over time.
Truecaller targets a revenue growth of at least 45 percent between 2021-2024e. After 2024 the EBITDA-margin should be at least 35 percent. The sum of the year-on-year growth and the EBITDA-margin should amount to at least 70 percent (a variant of the rule of 40 that tries to balance growth and profitability). We don’t think it will be difficult to reach these targets and the analyst estimates we have looked at are cautious, especially regarding profitability. In our preliminary prognosis for 2023, our EBITDA-estimate is around 16 percent ahead of the analyst estimates that we’ve studied. This is based on that Truecaller can continue to grow sales much faster than hiring new people while the gross margin improves slightly in coming years.
The gross margin is an interesting aspect of the equity story. Truecaller’s gross margin amounts to approximately 70 percent. Most of the cost of sales consists of platform fees to Apple and Google. Since Apple and Google practically control the distribution channels for apps together, a duopoly has occurred and prices for app-developers such as Truecaller have remained high around 25-30 percent of sales. This situation is now heavily criticized from all parts of the world since the situation is not considered competitive, for example
look at this analysis about an American court ruling concerning a twist between Epic Games and Apple. We believe Google and Apple’s fees will decrease over time – which would be a positive event for Truecaller. Furthermore, Truecaller’s new business deal bypasses Goggle and Apple, which gives a gross margin of close to 100 percent. This will strengthen the profitability even more.
There are of course risks associated with the dependence on Google/Apple (which is the case for every company in the application business); the geographical exposure and one should never write off the threat of competition even if it seems far away at this stage. However, we do believe the benefits outweighs the negatives. Truecaller has excellent financial characteristics, operational founders with large shareholdings who will remain active in the business and some of the world’s most well-known investors behind it. We therefore look forward to being included as an anchor investor ahead of the stock exchange listing on October 8th. We are even more excited to follow the company’s successes in current and new markets in the coming years.
CVS Group
One of the happiest days of the month was when our veterinarian company CVS Group released their interim numbers. Once again, the company beat analysts’ expectations which have been raised several times over the course of the year. In the first two months of the new financial year (which begins in July), the company has grown by 17 percent. This can be compared with the growth expectations for the full year which, before the report release, were 7 percent. Once again, analysts have thus far been “forced” to upgrade their assumptions. In a sour September stock market, the share fell 3 percent.
It becomes clear that the positive effect of the pandemic on pet ownership is more tenacious than ever. Pets live for many years, and we believe many underestimated the importance of the large number of new customers during the pandemic. Below is a graph of Google searches for veterinarians in the UK as well as data from the Swedish Board of Agriculture regarding the number of newly registered dogs. We speculate that the UK has similar trends as Sweden. The data points are also positive for our other pet company Swedencare. Pet companies are obviously still hot; right now there’s a bidding war going on over the German pet company Zooplus, where EQT is currently in the lead with the highest bid. We also note that there have been several venture capital-led acquisitions of veterinary companies at higher multiples than CVS is valued at.

Source: Jordbruksverket, Coeli

Source: Google Trends, Coeli
Lindab
Since our first investments in Lindab in the autumn of 2019, the thesis has always been that the building systems business segment did not fit into the business and in September, management finally found a buyer for the company. The transaction entails a write-down of goodwill corresponding to SEK 430 million, but it is cash flow neutral. Lindab took the opportunity to update its financial targets; the company now wants to grow by 10 percent per year (of which approximately two thirds are through acquisitions) and reach an operating margin of at least 10 percent (previously 10 percent over a business cycle). The share responded positively to the message.
We noted broad insider purchases in Lindab during the month, also from CEO Ola Ringdahl himself, which we think bodes well for the report in October. Despite this the share price decreased 8 percent in September.
Victoria
We have written several times about the British flooring company Victoria, which in September had a weak share price development of 17 percent. By all accounts, the company is doing well – during the month it was reported that sales rose 70 percent compared to 2020, and 50 percent compared to 2019. If you only partially extrapolate these figures for the rest of the year, it is obvious that analysts’ expectations are too low. We believe that this month’s decline is related to flows: growth companies and small and mid-cap companies were some of the most affected sectors in September – Victoria was hit from both sides. We have increased our position in recent days.
The Pebble Group
One of the month’s (few) joys was Pebble Group. As we previously wrote, the company is active in the market for gift advertising, i.e. gifts that companies give to customers, employees, and other stakeholders for marketing purposes. In September the company came out with its half-year figures that were better than expected. Pebble’s software division, Facilisgroup, is growing better than our expectations. This is also the part we believe the market is valuing too low. The stock rose 10 percent in September.
Knaus Tabbert
During the last trading day in September, our German motorhome manufacturer Knaus Tabbert announced that the forecasts for 2021 must be lowered due to component shortages. We are not particularly surprised that this has happened given what we have seen from other vehicle manufacturers. If the company can remedy these supplier problems, management believes that 2022 will be unaffected at best, as Knaus still has a bursting order book, increased production capacity and more suppliers from January next year. The share fell 7 percent in September.
Short positions
The short portfolio contributed with a negative result during the month. Our short-term negative positions in the German DAX had the largest negative contribution. Some stock specific short positions that contributed positively to the result were Swedish Dometic, German Henkel and Norwegian NEL.
Exposure
The net exposure, adjusted for our unlisted holdings, at the beginning and end of the month was 76 and 74 percent, respectively.
Summary
September's negative return of x percent also meant the end of the fund's, so far, longest period of positive return (10 months). We are obviously disappointed with that, but we have been in the game long enough to understand that equities sometimes must fall to be able to refuel and continue their upward trajectory. In general, September was the weakest month for many equities since the crisis started 1.5 years ago. September, otherwise, started strong for us and was a continuation of an unusually good performance at the end of August. Our companies presented many good news (except for Knaus Tabbert on the last day of the month) but small-caps and especially those categorized as growth shares, had a very weak performance during September. The main reason for this was, as previously mentioned, the change in the US long-term interest rate and general "risk off".
The picture below shows the development since March last year compared with the corresponding time intervals in the financial crisis in 2009 and onwards. Both periods have shown an unusually strong recovery and the current trend is even stronger than when the financial crisis raged 12 years ago.

Source: Goldman Sachs
Since the crisis started 1.5 years ago, we have had three different phases. The first and shortest, "despair", showed a decline in prices of 33 percent. The second phase, "hope", ended at the beginning of this year and showed a very strong return of 79 percent despite declining earnings. The last, “growth”, where we are now, has shown +11 percent in share prices with sharply rising growth for companies' earnings, but at lower valuations.

Source: Goldman Sachs
The recovery for American companies (below) has been extremely strong and compared to 2019, the 2021 profits will be approximately 36 percent higher. Very impressive.

Source: Goldman Sachs
It is very gratifying that Europe, for once, is keeping up with the United States and showing strong profit growth. Compare this with the non-existent profit growth between 2007–2019 (!)

Despite rising equity prices, valuations have fallen and Europe is now trading around 16x the profit 12 months ahead. It's not very strenuous (we think). For an average commercial property, you can get a return of maybe 3 percent before net financial costs. After financing, this corresponds to at least P/E 50x. And paying to lend to different countries does not feel like an exciting alternative either.

Source: Goldman Sachs
The valuation of global shares in relation to global GDP looks more strained. A major reason for this is the central banks' aggressive policy.

The valuation of the major leading technology companies is at an average level seen from the last five years.

Source: Goldman Sachs
The image below is striking. It shows that Swedish property prices, which have risen by almost 200 percent over the past 15 years, have had the same development as the money supply. In theory, price per m2 and krona is unchanged for the past 15 years. Is there anyone who still doubts that the world's central banks are responsible for the largest wealth creation in human history? It is important to be on the wagon because when it is gone you’ve missed it. And what central banks cannot push, the price of bitcoin for example, rises even more as central banks cannot make more of it. The opportunities for central banks to reverse the band are few. In the long run, this means that the next 10 years will, overall, be a good period for, for example, stock picking. All forms of uniqueness (growth) will be highly valued to compensate for the fact that the value of money decreases at a rapid pace.

If there is anyone who is still not convinced, take a look at the picture below. The market capitalization of the S&P500 divided by the Fed's balance sheet….

Source: Bloomberg
Onwards and upwards. The wealth of American households is accelerating away from the change in GDP.

Thank you Fed and all the world central banks!

Citigroup's surprise index has weighed down and analysts' profit estimates are also starting to soften. Not a good combination and it has undoubtedly contributed to the weak development in the stock markets recently.

It took a full 219 days for the S&P500 to have a decline of 5 percent. We will see how high the next bar will be.

Timing is everything. A fascinating graph that shows the importance of having reasonable timing in decisions.

Source: Goldman Sachs
Despite a difficult month behind us, it feels reasonable to expect a stronger market during the last quarter of the year. Our view is that we are still in a rising market, although we are likely to experience some turbulence for a few more weeks. "Bear markets" are constantly declining with sharp rallies while "bull markets" continue to rise with some strong drawdowns. We therefore believe that we are still in a rising market.
Some statistics to cheer you up. The S&P500 managed to rise by 0.2 percent in the third quarter (Europe -1.9 percent) which means six consecutive positive quarters. This has only happened eight times before and only on one of the (eight) occasions has the following quarter yielded a negative return. Two quarters later, it has in all cases yielded a positive return. In addition, for the past 20 years, October has been the fourth best month, thus much better than its reputation. Having pointed that out, October takes first place in terms of most frequent daily movements that exceed one percent.
The Stockholm Stock Exchange, which is an excellent reference point, had risen by 30 percent at its highest about a month ago, but is currently at 20 percent. Even more important is that measured in USD, OMX has "only" risen by 13 percent, which is in line with the US stock markets. This is hardly excessive given the profit growth among the companies. The risk premium in the market is high.
Investors are reasonably careless, and we are approaching the turn of the year. Global growth is well above average and interest rates are extremely low. Given how cruel the market has been to many investors this year, with sector rotations and a high concentration of companies driving performance, it almost feels obvious that the broad mass of investors will continue to reduce risk in their portfolios and then be short equities at year-end when the market rises. We'll see, but that's our main scenario right now.

We are now closing the books for the third quarter, and we look forward to the end of the year and above all the entrance for Truecaller on the Stockholm Stock Exchange on October 8!
Thank you for this month and we'll hear from you later.
Mikael & Team
Malmö on 5 October
[/et_pb_text][et_pb_text admin_label="Coeli Nordic Corporate Bond Fund R-SEK" _builder_version="3.0.89" background_layout="light" module_class="gen-table-module" disabled_on="on|on|on" disabled="on"]
Coeli Nordic Corporate Bond Fund
| Performance in Share Class Currency | 1 Mth | YTD | 3 yrs | Since incep |
| Coeli Nordic Corporate Bond Fund - R SEK | 1.30% | -0.93% | 3.38% | 14.52% |
| | | | |
[/et_pb_text][et_pb_text admin_label="Coeli Nordic Corporate Bond Fund R-SEK" _builder_version="3.0.89" background_layout="light" module_class="gen-table-module" disabled_on="on|on|on" disabled="on"]
[cg_linear_graph id="31122"]
[/et_pb_text][et_pb_image _builder_version="3.0.89" src="https://coeli.com/wp-content/uploads//2020/10/ncbr.png" show_in_lightbox="off" url_new_window="off" use_overlay="off" always_center_on_mobile="on" force_fullwidth="off" show_bottom_space="on" disabled_on="on|on|on" disabled="on" /][/et_pb_column][et_pb_column type="1_3"][et_pb_image _builder_version="3.0.89" src="https://coeli.com/wp-content/uploads/2019/01/Gustav-Fransson6.jpg" show_in_lightbox="off" url_new_window="off" use_overlay="off" always_center_on_mobile="on" force_fullwidth="off" show_bottom_space="on" custom_margin="||21px|" disabled_on="on|on|on" disabled="on" /][et_pb_text admin_label="Namn och title" _builder_version="3.0.89" background_layout="light" module_class="gen-single-ingress-module" custom_margin="||40px|" disabled_on="on|on|on" disabled="on"]
Gustav Fransson
Portfolio Manager of Coeli Nordic Corporate Bond Fund
[/et_pb_text][et_pb_image _builder_version="3.0.89" src="https://coeli.com/wp-content/uploads/2018/10/Alexander-Larsson-Vahlman.jpg" show_in_lightbox="off" url_new_window="off" use_overlay="off" always_center_on_mobile="on" force_fullwidth="off" show_bottom_space="on" custom_margin="||21px|" disabled_on="on|on|on" disabled="on" /][et_pb_text admin_label="Namn och title" _builder_version="3.0.89" background_layout="light" module_class="gen-single-ingress-module" custom_margin="||40px|" disabled_on="on|on|on" disabled="on"]
Alexander Wahlman
Senior Analyst
[/et_pb_text][et_pb_text admin_label="Fund Overview" _builder_version="3.0.89" background_layout="light" custom_margin="||20px|" module_class="gen-trustee-single-table"]
Fund Overview
| Inception Date | 2017-12-20 |
| Investment management fee (share class I SEK) | 1.00% p.a + 20% Performance fee (OMRX T-Bill Index) |
| Performance Fee. Yes | 20% |
| Risk category | 5 of 7 |
[/et_pb_text][et_pb_text admin_label="Top Holdings (%)" _builder_version="3.0.89" background_layout="light" custom_margin="||20px|" module_class="gen-trustee-single-table" disabled_on="on|on|on" disabled="on"]
Top Holdings (%)
| LANSBK 1.25% 18-17.09.25 | 4.1% |
| NORDEA HYP 1.0% 19-17.09.25 | 4.1% |
| SWEDBK 1.0% 19-18.06.25 | 4.1% |
| WHITE MOUNT FRN 17-22.09.47 | 3.9% |
| B2 HOLDING FRN 19-28.05.24 | 2.9% |
[/et_pb_text][/et_pb_column][/et_pb_row][/et_pb_section][et_pb_section bb_built="1" fullwidth="off" specialty="off" _builder_version="3.0.89" module_class="gen-trustee-single-yield-section gen-pattern-section" custom_padding="0px|||"][et_pb_row _builder_version="3.0.89" custom_padding="||53px|"][et_pb_column type="4_4"][et_pb_text admin_label="VIKTIG INFORMATION" _builder_version="3.0.89" background_layout="light" module_class="gen-trustee-single-warning-blurb"]
IMPORTANT INFORMATION. This is a marketing communication.
Before making any final investment decisions, please refer to the prospectus of Coeli SICAV II, its Annual Report, and the PRIIP of the relevant Sub-Fund. Relevant information documents are available in English at coeli.com. A summary of investor rights will be available at
https://coeli.com/regulatory-information-coeli-asset-management-ab/.
Past performance is not a guarantee of future returns. The price of the investment may go up or down and an investor may not get back the amount originally invested.
[/et_pb_text][/et_pb_column][/et_pb_row][/et_pb_section]