[et_pb_section bb_built="1" fullwidth="off" specialty="off" _builder_version="3.0.89" background_image="https://coeli.com/wp-content/uploads//2018/08/malmo-bro-comp.jpg" parallax="on" module_class="gen-trustee-single-hero"][et_pb_row][et_pb_column type="4_4"][/et_pb_column][/et_pb_row][/et_pb_section][et_pb_section bb_built="1" fullwidth="off" specialty="off" _builder_version="3.0.89" custom_padding="0px||0px|"][et_pb_row][et_pb_column type="4_4"][/et_pb_column][/et_pb_row][et_pb_row _builder_version="3.0.89" background_position="top_left" background_repeat="repeat" background_size="initial" custom_padding="0px|||" custom_padding_phone="23px|||" custom_padding_last_edited="on|tablet" module_class_2="gen-trustee-single-sidebar" module_class="gen-single-news-content-row "][et_pb_column type="4_4"][et_pb_text admin_label="Tillbaka-knapp" _builder_version="3.0.89" background_layout="light" border_style="solid" custom_margin_tablet="||17px|" custom_margin_last_edited="on|desktop" module_class="gen-back-button hide-in-print" border_style_all="solid"]
Note that the information below describes the share class (I SEK), which is a share class reserved for institutional investors. Investments in other share classes generally have other conditions regarding, among other things, fees, which affects the share class' return. The information below regarding returns therefore differs from the returns in other share classes.
Before making any final investment decisions, please read the prospectus, its Annual Report, and the KID of the relevant Sub-Fund here
[/et_pb_text][et_pb_text admin_label="Tillbaka-knapp" _builder_version="3.0.89" background_layout="light" border_style="solid" custom_margin_tablet="||17px|" custom_margin_last_edited="on|desktop" module_class="gen-back-button hide-in-print" border_style_all="solid"]
This material is marketing communication
[/et_pb_text][et_pb_text admin_label="Datum / Skriv ut" _builder_version="3.0.89" background_layout="light" border_style="solid" custom_margin_tablet="||17px|" custom_margin_last_edited="on|desktop" module_class="gen-single-news-date-module gen-trustee-print-module hide-in-print" locked="on" border_style_all="solid"]
[blog_post_date]
Print
[/et_pb_text][et_pb_text _builder_version="3.0.89" background_layout="light"]
Monthly Newsletter Coeli Absolute European Equity – April 2023
APRIL PERFORMANCE
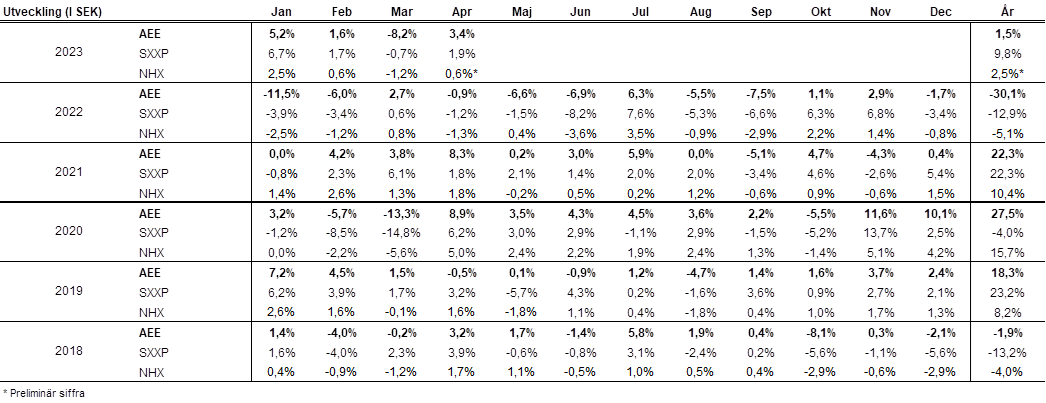
The fund’s value increased by 3.4% in April (share class I SEK). The Stoxx600 (broad European index) increased during the same period by 1.9% and HedgeNordic’s NHX Equities increased provisionally by 0.6%. The corresponding figures for 2023 are an increase of 1.5% for the fund, +9.8% for the Stoxx600 and +2.5% for NHX Equities.

EQUITY MARKETS / MACRO ENVIRONMENT
The world's stock markets came up for air again after the banking turmoil, temporarily, subsided. Apart from that it was unusually quiet in terms of major macroeconomic news, which was appreciated by the world's investors. The broad European index rose 1.9% in April compared with the S&P500, which rose 1.4%, both in local currencies. Measured in euros, the S&P500 was unchanged and the European stock markets continue to develop stronger than their American counterparts. The fund rose by 3.4% and several positive company news contributed to the good performance, more about that in the long positions section.
Our thesis last month that the reporting season would be strong has so far played out. Large companies such as LVMH, Hermes, L'Oreal, BASF, Volvo, Atlas Copco and several European banks all came in with very strong reports.
In the US, expectations were low with consensus expecting a seven percent drop in profits for the first quarter. After 64% of companies reported, 54% of companies have surprised positively, which is above the historical average of 46%. Both turnover and margins have been better than expected and the profit reduction is at the time of writing minus five percent.

The best sector in Europe in April was real estate, which rebounded by 5.2% after a weak development last month. The fund's two investments in SLP and Corem participated in the rise and increased by 10 and 12% respectively. The bank index rose by just over two percent and the worst sectors were technology and raw materials, which fell by around five percent.
 Source: Bloomberg
"The banking crisis is over". Politicians and bank CEOs have been vocal in the media in recent weeks saying that the problems with the American smaller banks were a temporary blip and that it is now behind us. In the past week, it was the managements of BNP Paribas, Nordea and Standard Chartered who proclaimed it. On May 1st, US authorities approved JP Morgan's purchase of troubled First Republic, which is arguably a big step in the right direction. Admittedly, he speaks for himself, but when CEO Jamie Dimon says “the system is very, very sound" and "this is getting near the end of it", you listen a little extra. Obviously not everyone did. On Tuesday, May 2nd,several regional banks came under renewed pressure with large declines as a result. It would be strange if three out of 4,600 regional banks failed while 4,597 escaped unscathed. The probability that the Fed's aggressive interest rate hikes left a deep impression on several banks' balance sheets is probably high, and tonight there will be another expected increase of 25 basis points.
The tougher conditions for the American banks are now reflected in less lending. Lending is likely to slow down considerably in the coming quarters (forecast blue dashed line) and the banking crisis has likely removed, at least, one interest rate hike from the Fed.

On Tuesday, May 2nd, the ECB published statistics showing that European banks also saw a clear slowdown in new credit. The sharply rising interest rates are now leaving increasingly clear traces in the economy, and continued falling inflation will lead to falling interest rates. The picture below shows the percentage of banks that have tightened corporate lending.

The volatility index, VIX, is at surprisingly low levels considering all that is happening on both the macro and micro levels. However, the bank stress in March is clearly visible.
 Source: Bloomberg
The Riksbank (Swedish Central Bank) raised the interest rate by a further 50 basis points in April, and the key interest rate is now 3.5%. There was no clear agreement as two of the members wanted to increase by only 25 basis points. The image above and below reinforces our view that the Riksbank should hold off on further interest rate increases and give the process more time to study how much inflation slows down with interest rate increases that have already been made.
Below is a fascinating and positive picture of Swedish PPI since 1976. The price that is measured is the price that Swedish producers receive when they sell their product versus the price that the buyer pays when the products enter Sweden. A genuine collapse that will eventually filter down to the consumer level.
 Source: Bloomberg
Swedish consumers are on their knees. Unlike both American and European consumers who have started to wake up, Swedish consumers are still experiencing what could be called a perfect storm. The latest data point shows that Swedish consumption is approximately 13% below the long-term trend line. These are very dramatic deviations.

The money supply in Sweden is decreasing at a rate rarely seen. The development looks about the same in the US and it is likely a major contributor to the bank stress we have seen in recent weeks. If inflation follows the development of the money supply with a certain time lag (as it has done historically), inflation will soon drop sharply.

As we mentioned a few months ago, the tone regarding the US debt ceiling is now starting to increase in intensity. We note that CDSs on the US government have risen very sharply in a short time, i.e., the cost of insuring against the US government going bankrupt has risen. If the politicians do not resolve the situation soon, for example, hundreds of thousands of government employees may soon risk not getting their salary paid. The last word has not been said in this drama and we will have reason to revisit it soon.
 Source: Bloomberg
A little more cheerful tone from China, which in April published a strong Q1 GDP figure and activity data for March. GDP rose by 4.5% y/y (consensus: 4.0%) while inflation is below 1%!
 Source: Kepler Cheuvreux
President Macron and Ursula von der Leyen made a joint visit to China during the month and met President Xi Jinping. Much of the meeting was about Ukraine and how the situation should be resolved – the outcome was poor. China has not condemned Russia's terrorist acts and wants peace through negotiating with Ukraine giving up some territorial areas. Ukraine refuses to give in for good reasons. In the coming weeks, a major offensive from Ukraine is likely to take place with the help of an enormous number of new weapons that have just arrived from the West.
OPEC had a meeting on April the 3rd where they surprised the market with new production cuts. Oil rose 6% that day but is now, a month later, lower than before the meeting. Certainly, both surprising and annoying for the oil producers, but good for their customers and inflation.
 Source: BloombergLong positionsBonesupport
After, in our opinion, an unwarranted 20% loss after last quarter's report, there was a cascade of upgrades from analysts ahead of the 2023 first quarter report. Despite inflated expectations, the company came in with a really strong report, which sent the stock up another 6% on the day of the report. Sales came in 10% higher than expected and the company showed a profit for the first time. Turnover grew by 66% (!) adjusted for currency, an unparalleled feat. The highlight of the report was that Cerament G is growing strongly in the USA, where the product was recently launched. In five months, the product already sells for SEK 50 million in the US, rolling 12 months.
We wrote in the September 2022 monthly newsletter that we thought the market underestimated the opportunity which had opened-up in the US. So far, we have been right given how the revisions to the estimates have been. We also hope that the market begins to realize the elegantly designed business model that enables this growth as well as the possibility of rolling out new products through the same channel. Europe (which almost gets a little forgotten in the context) is slowly but surely starting to loosen up after being heavily affected by the pandemic. During the first quarter, the company grew in Europe 32% in a constant currency context. We continue to like Bonesupport and follow its journey.
SLP
Our favorite little real estate company reported their Q1 results in April, and they delivered, in our opinion, the sector's strongest quarterly report. The company released a report which, despite increased yield requirements (+20 basis points), had positive value changes on the properties because of positive net letting, off-market acquisitions and higher rental income. The management result came in well above expectations and grew 35% compared to last year. This year, the company has acquired properties for just over 1 billion. SLP has a strong balance sheet and is one of the companies that could take advantage of the stressed situation in the real estate sector and acquire at a good yield. The company trades at a premium of 18% to the latest reported NAV, but we believe that the valuation will fall quickly as the company grows. On May 3rd, the company announced and carried out a directed issue of 550m to a limited number of institutional investors. The price was SEK 25 per share to be compared with the latest NAV figure of SEK 22.40, so an immediate value creation. The next step will be to acquire properties at attractive levels from stressed sellers. To be continued.
Corem
Corem's report came in slightly better than expected on underlying operating results and the stock was basically unchanged on the day of the report. So far this year, the company has sold properties for SEK 7.6 billion, most of them at book value, which is a brilliant deal for shareholders when the stock trades at a 68% discount to NAV. Financial aspects aside, the operating net number was strong, and the company also had a positive net rental in the quarter of 33m. This suggests that the underlying business is still fit and healthy. Interest costs were somewhat higher than expected. This was a theme we saw in several real estate companies. The company announced that it will continue to sell real estate and the sales it made this year are enough to cover bond maturities in 2023. After all the sales at attractive prices, Corem controls its financial situation better and can hopefully enter a calmer phase.
Sedana Medical
After an incredibly tough 2022, 2023 has started out more promising in terms of share price after a rise this year of 37%. The report for the first quarter of 2023 proved that Sedana can grow again. In the first quarter, the company beat expectations when sales grew by 5% organically, despite the market still being difficult in many geographies. The new management has also done a good job of cost control.
Much of the equity story for Sedana Medical is about the USA, where a market launch is expected in the first quarter of 2025. At the same time, we believe that the European launch has clear relevance for the USA - if you succeed in commercializing the product in Europe, you increase confidence that you can succeed with the same thing on the other side of the Atlantic. With the new management in the company, we feel secure that Sedana's organization has changed to be more commercial. The share rose 20% in April and made a nice contribution to the result despite the small position size at entry.
CVS Group
During the month, we received a nice contribution from the British veterinary company CVS Group, which rose by 14%. To be honest, it wasn't really the company's merit. Essentially, the price reaction came from EQT making a bid at a 51% premium for Dechra Pharmaceuticals, a British pharmaceutical company focused on animals. Although CVS Group is hardly in the business of drug development, the bid clearly gave a boost to the sector that spilled over to CVS Group's share price.
LVMH
In April, LVMH reported that it once again released a fantastic report, which sent the stock up 6%. YTD, the share has risen a whopping 28% and the market capitalization passed 500 billion euros for the first time ever for a European company. Acceptable.
Sales came in about 6% higher than expectations, driven by significantly better organic growth than forecasted. Concerns about a weaker China and general macro worries were as if blown away, especially when the company confirmed that the strong development was expected to continue.
Kion
Kion, where we have been invested since the beginning of the year, had a reverse profit warning during the quarter. This is especially pleasing as Kion is a German, very cyclical company and is undergoing extensive restructuring after a challenging 2022 to say the least. Operating profit for the first quarter was approximately 30% above consensus and the full-year forecast was revised upwards. The major part was driven by the ITS (industrial trucks segment) because of simplified supply chains and better operational mobility. The free cash flow was also better than expected, which is an important part of the equity story. Their other segment SCS (the service segment) is still weak, but the full-year forecast is maintained and there are hopes that things will ease towards the end of the year and that the company will measure against simpler comparative figures. After completed upward adjustment, the company is valued at approximately 9x P/E 2024e, well below the historical average of around 15x.
Short positions
The short portfolio contributed with a small negative result during the month. The main drivers for the negative result was our short positions in a Swedish small company index and on the Swedish OMXS30 index.
Exposure
The net exposure, adjusted for our unlisted holdings, at the beginning and end of the month was 76% and 77% respectively.
Summary
After the first four months of the year, it can be concluded that European stock markets continue to develop stronger than the American ones and the beginning of the year relative to the USA is the strongest since 2012. What is astonishing in the USA is the concentration of the rise with a very strong price development for the five major technology companies. The month's picture below shows that they rose on average by 31% compared to the other 495 companies that only rose by 3%. Measured in euros, the development for the 495 companies is plus or minus zero so far.
 Source: Goldman Sachs
The image below shows the breadth of the market. The lower the curve, the fewer companies that are behind the development of the index. Only 11 times previously in the past 43 years has the index been so dependent on so few stocks. All other things being equal, this means that the upswing is fragile, and this can have a negative impact on future development. On nine occasions since 1980 (out of the 11), the development in the subsequent time period has been lower than the average.

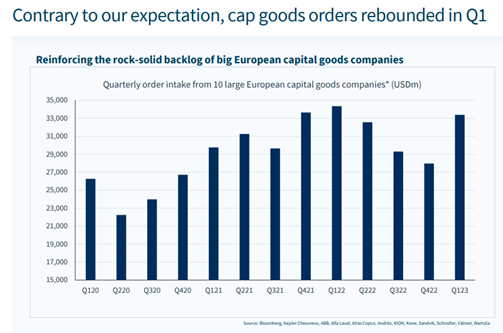
In Europe, one of the big positive surprises has been the strong reports from industrial companies which included healthy increasing order books. Gloomy investors had low expectations going into the report season, and the fact that Sweden's most valuable company, Atlas Copco, rises by a whopping 15% on report day, says a lot about investors, analysts, and the company itself.
Europe's strong development is fair when you study the picture below, which shows the profit development for European companies in relation to American ones. The dark blue line shows Europe's return relative to the American one and the light blue the relative profit development.

Despite a strong development, the valuation difference with the US is still at high levels. Below is the difference in percentage of twelve-month forward-looking P/E ratios for Europe compared to the US. The light blue line is adjusted for different sector weights.

Below is a spider diagram showing the difference in valuation for each sector. All sectors are valued higher in the US. For example, energy in Europe is valued at 7x, while the corresponding multiple in the US is 11x.

There are, of course, various reasons why American companies typically have a strong valuation. One is growth, and the sales trend for different geographic regions is illustrated below. Japan feels like so so….

The American companies also invest more than the European ones. This contributes to the stronger sales growth and a higher return on capital, which in turn determines the valuation.

It is pleasing to note that share buybacks have increased in Europe in recent years. In most cases, it creates significant shareholder value without any operational risk. In some countries, such as Germany, it is still regarded with great skepticism. The German stock market is also one of the lowest valued in Europe. In Sweden, buybacks are significantly more common, and the Swedish stock exchange also has a better valuation. Several factors impact valuations, but buybacks often create shareholder value.

In summary, we will soon be through an unusually strong reporting season with relatively little impact on the broad index levels, but often with a large impact on individual stocks. In a short time, bids for various companies have poured in after an M&A activity that for a long time was conspicuous by its absence. In fact, I cannot recall that there have been so many takeover offers in such a short period of time during my almost 30 years in the industry. It indicates a latent need, strong balance sheets and greater optimism among companies than among investors.
Earnings estimates will be adjusted up slightly after the reports and the buybacks will start rolling again. There are several significant macro and geopolitical challenges that are dampening risk appetite and we are now entering the summer period, which has historically had a weaker development compared to the winter term. As for the American banking crisis, the last word has probably not been said.
The central banks led by the Fed are now close to their interest rate peak, which has been a huge headwind for risk appetite in the past year. Once the central banks stop, they usually never stay there for long. They are normally positioned in some form of direction, and we believe that interest rate cuts will come earlier than expected. The next challenge is to balance the interest rate weapon against a possible recession. We continue to focus on our company analysis, where we had a high level of precision this reporting period as well.
We wish you a wonderful May with hope for lots of sun and warm temperatures!
Mikael & Team
Malmö on May 5th, 2023
[/et_pb_text][et_pb_post_title _builder_version="3.0.89" title="on" meta="off" author="off" date="off" categories="off" comments="off" featured_image="off" featured_placement="below" text_color="dark" text_background="off" border_style="solid" module_class="gen-single-news-heading-module gen-trustee-single-headline" date_format="d M, Y" border_style_all="solid" disabled_on="on|on|on" disabled="on" /][et_pb_text admin_label="Coeli Nordic Corporate Bond Fund R-SEK" _builder_version="3.0.89" background_layout="light" module_class="gen-table-module" disabled_on="on|on|on" disabled="on"]
Coeli Nordic Corporate Bond Fund
| Performance in Share Class Currency | 1 Mth | YTD | 3 yrs | Since incep |
| Coeli Nordic Corporate Bond Fund - R SEK | 1.30% | -0.93% | 3.38% | 14.52% |
| | | | |
[/et_pb_text][et_pb_text admin_label="Coeli Nordic Corporate Bond Fund R-SEK" _builder_version="3.0.89" background_layout="light" module_class="gen-table-module" disabled_on="on|on|on" disabled="on"]
[cg_linear_graph id="31122"]
[/et_pb_text][et_pb_image _builder_version="3.0.89" src="https://coeli.com/wp-content/uploads//2020/10/ncbr.png" show_in_lightbox="off" url_new_window="off" use_overlay="off" always_center_on_mobile="on" force_fullwidth="off" show_bottom_space="on" disabled_on="on|on|on" disabled="on" /][et_pb_image _builder_version="3.0.89" src="https://coeli.com/wp-content/uploads/2019/01/Gustav-Fransson6.jpg" show_in_lightbox="off" url_new_window="off" use_overlay="off" always_center_on_mobile="on" force_fullwidth="off" show_bottom_space="on" custom_margin="||21px|" disabled_on="on|on|on" disabled="on" /][et_pb_text admin_label="Namn och title" _builder_version="3.0.89" background_layout="light" module_class="gen-single-ingress-module" custom_margin="||40px|" disabled_on="on|on|on" disabled="on"]
Gustav Fransson
Portfolio Manager of Coeli Nordic Corporate Bond Fund
[/et_pb_text][et_pb_image _builder_version="3.0.89" src="https://coeli.com/wp-content/uploads/2018/10/Alexander-Larsson-Vahlman.jpg" show_in_lightbox="off" url_new_window="off" use_overlay="off" always_center_on_mobile="on" force_fullwidth="off" show_bottom_space="on" custom_margin="||21px|" disabled_on="on|on|on" disabled="on" /][et_pb_text admin_label="Namn och title" _builder_version="3.0.89" background_layout="light" module_class="gen-single-ingress-module" custom_margin="||40px|" disabled_on="on|on|on" disabled="on"]
Alexander Wahlman
Senior Analyst
[/et_pb_text][et_pb_text admin_label="Top Holdings (%)" _builder_version="3.0.89" background_layout="light" custom_margin="||20px|" module_class="gen-trustee-single-table" disabled_on="on|on|on" disabled="on"]
Top Holdings (%)
| LANSBK 1.25% 18-17.09.25 | 4.1% |
| NORDEA HYP 1.0% 19-17.09.25 | 4.1% |
| SWEDBK 1.0% 19-18.06.25 | 4.1% |
| WHITE MOUNT FRN 17-22.09.47 | 3.9% |
| B2 HOLDING FRN 19-28.05.24 | 2.9% |
[/et_pb_text][/et_pb_column][/et_pb_row][et_pb_row _builder_version="3.0.89" background_position="top_left" background_repeat="repeat" background_size="initial" module_class="gen-single-news-content-row gen-trustee-single-content-row" custom_padding="0px|||" custom_padding_phone="23px|||" custom_padding_last_edited="on|tablet" module_class_2="gen-trustee-single-sidebar" disabled_on="on|on|on" disabled="on"][et_pb_column type="2_3"][et_pb_text admin_label="Tillbaka-knapp" _builder_version="3.0.89" background_layout="light" border_style="solid" custom_margin_tablet="||17px|" custom_margin_last_edited="on|desktop" module_class="gen-back-button hide-in-print" border_style_all="solid"]
Note that the information below describes the share class (I SEK), which is a share class reserved for institutional investors. Investments in other share classes generally have other conditions regarding, among other things, fees, which affects the share class' return. The information below regarding returns therefore differs from the returns in other share classes.
Return to Fund page
[/et_pb_text][et_pb_text admin_label="Datum / Skriv ut" _builder_version="3.0.89" background_layout="light" border_style="solid" custom_margin_tablet="||17px|" custom_margin_last_edited="on|desktop" module_class="gen-single-news-date-module gen-trustee-print-module hide-in-print" locked="on" border_style_all="solid"]
[blog_post_date]
Print
[/et_pb_text][et_pb_post_title _builder_version="3.0.89" title="on" meta="off" author="off" date="off" categories="off" comments="off" featured_image="off" featured_placement="below" text_color="dark" text_background="off" border_style="solid" module_class="gen-single-news-heading-module gen-trustee-single-headline" date_format="d M, Y" border_style_all="solid" /][et_pb_text _builder_version="3.0.89" background_layout="light"]
Utveckling september
Fondens värde sjönk -5,1 procent i september (andelsklass I SEK). Stoxx600 (brett Europaindex) sjönk under samma period med -3,4 procent och HedgeNordics NHX Equities var preliminärt oförändrat. Motsvarande siffror för 2021 är en ökning om +21,6 procent för fonden, +14,0 procent för Stoxx600 och +6,4 procent för NHX Equities.


Equity markets / Macro environment
After seven consecutive months of positive performance the world’s stock markets were poised for some degree of turbulence. Volatility was especially high in some equities and on Monday, September 20, the highest nominal volume ever traded was reached in options on the S&P500 (!) The broad European index fell by 3.4 percent in September compared to the S&P500 which fell by 4.8 percent. The fund also had its first negative performance since October last year with a decline of 5,1 percent. More about that later.
Despite high levels for many stock indices, sentiment among investors has been relatively gloomy. Bank of America's monthly survey recently showed that only 13 percent of managers expect a positive market in the future, which is the lowest figure since April 2020 (and that was clearly wrong). The reasons cited are China's growth problems, the crisis-stricken Chinese real estate giant Evergrande, the development of the delta variant, declining profit growth and, of course, rising inflation. However, they are still overweight equities which is perhaps not so strange when you have to pay to lend your capital to countries. As interest rates rose at the end of the month, the German 10-year interest rate followed with a giant step from - 0.25 percent to - 0.17 percent… The picture below is an overall risk indicator, and we are around zero (neutral).

The news flow in September began with record high inflation figures in Europe at +3.0 which exceeded market expectations. The corresponding figure in July was + 2.2 percent. It was the fastest growth rate since November 2011 and several countries recorded up to five percent in inflation rate. The pressure on the ECB to reduce its support measures is increasing. On Friday, October 1, new inflation figures came in for September, which showed a further acceleration in the inflation rate by +3.4 per cent.
The rate of change can be mostly attributed to rising energy prices that are starting to create real problems in the world's economies as well as agricultural shifts. The picture below shows that food prices are at record high levels over the past 60 years. The biggest losers are the poorest part of the population.

In the slightly longer term it is forecasted that it is not excessive demand that will drive inflation, but rather a limited supply, and then both in terms of products and labour. At the end of September, long queues were reported at petrol stations across the UK when fuel ran out and there were not enough truck drivers to refuel. Prime Minister Boris Johnson urges his citizens to refuel sensibly and at a normal rate. You wanted Brexit, so there you go. In sheer desperation, Johnson has now issued 5,000 temporary short-term visas for temporary drivers. Good luck.
M25 spring 2022?

Below are European gas prices which have risen in a seemingly uncontrolled fashion and recorded the highest September prices ever. A silent prayer for the mild winter. We guess that this development will soon be a major topic in the media, and it will undoubtedly create various problems and somewhat reduce next year's expected growth. It feels reassuring that Per Bolund (Swedish Green Party MP) claims that there is no electricity shortage in Sweden because then the costs for ordinary people would be unbearably high during the winter (which of course they will be). Rising gas and electricity prices have led European politicians to start discussing billion-dollar subsidies (in euros) to households and manufacturers who will experience sharply rising electricity bills over the winter.

Source: Bloomberg
Henrik Svensson, site manager at the oil-fired power plant in Karlshamn (south Sweden), does not agree with Per Bolund that we have a surplus of electricity in the country. For large parts of September, the power plant ran at full capacity and burned 240k liters of oil per hour. Henrik Svensson believes that it is electricity shortages and high electricity prices that are behind the high production. He also says that there is a lack of planned power production in southern Sweden and that it will take many years before the electricity grid is strengthened and new electricity production is in place. Sweden today burns more oil than we have done in 10 years. A gigantic energy policy and climate policy failure signed by the Green Party.

Source: Steget efter
Winning candidate for this year's Christmas presents below.

The change in the US 10-year interest rate created considerable pressure on, primarily, growth stocks at the end of the month. The performance dispersion for different sectors was very large in September with oil shares as a clear winner. This was also felt in the last days of September.

Source: Bloomberg
Below is the development for the US 10-year interest rate. The turbulence in the stock market was caused by the change in interest rate level breaking through on the upside, as can be seen in the chart.

There have been countless attempts to explain the turbulence in recent weeks. The recent and significant amount of options being exercised, Evergrande, interventions by the Chinese government, Fed tapering, Bank of England expected to raise interest rates, delta variant, inflation, bottlenecks in production, difficulties in finding staff, rising energy prices and declining growth rates. We think it is enough to look at the picture below. Rising interest rates hit hard at growth companies' valuations.

Goodbye Mutti and thank you for an extraordinary effort for Europe!

Source: Nyhetsbyrån TT
She was politically in a class of her own during the euro crisis ten years ago and Sweden also has her to thank for a lot. Despite a somewhat weaker performance in recent years, German citizens have experienced significantly better economic development than many others.

On September 29, the covid-19 restrictions in Sweden were finally removed and we can now, in principle, start living a normal life again. The number of bookings for winter holidays skyrocketed to the great joy of the tourist and transport industry. In recent months, tourism activity in the Mediterranean has been "extraordinary" and much better than forecasted before the summer. Luxury travel is also reaching new heights. Private jet passengers to Mallorca increased by +70 percent in July compared to July 2019 with an average of 83 private jets per day landing in Palma. If you want to rent a yacht, you are being referred to next year as basically everything has already been fully booked.
We now belong to a minority group. Passively managed capital exceeds actively managed capital for the first time ever. This will give us more opportunities as mispricing increases.

In addition to being one of the world's best stock markets this year, Sweden also has the most listed companies in the entire EU. Bloomberg drew attention to the fact that there are now around 1,000 listed companies on the various trading platforms in Stockholm. More than 80 percent are smaller companies, and the list is filled with new listings every day until Christmas! For us, it is interesting as we are constantly looking for new potential core holdings. In recent weeks, we have identified one which we write about under Long Positions.
We end this section with a picture that well reflects today's political level.

Source: Kluddniklas
Long positions
Truecaller
During September, we did a lot of work on the Swedish company Truecaller which will go public on October 8th. Truecaller is one of the most interesting companies we’ve seen in recent years. Truecaller has developed a phone application that can, among other things, identify unwanted calls from, for example, telemarketers. The app is one of the top ten most downloaded applications globally, and in some of the main markets such as India, Nigeria and Indonesia, it is one of the three most downloaded apps. As a Swedish company with headquarters in Stockholm, the firm has chosen to list on the Swedish stock exchange, which we are very happy about.
Truecaller was founded in 2009 by Alan Mamedi and Nami Zarringhalam. They met at the Royal Technical University in Stockholm, and they continue to be active in the company as the CEO and Chief Strategic Officer (CSO), respectively. When they released the first version of the app, they received 10,000 downloads within one week. By 2013 they had reached over 10 million users globally and in Q2 2021 they had reached 278 million monthly users. Throughout their journey, Truecaller has attracted several well-known investors such as Sequoia Capital (early investors in Apple, Whatsapp, and Zoom among others), Atomica (Skype-founder Niklas Zennström’s investment company), and Kleiner Perkins (early investors in Google, Amazon, and Spotify among others).

Until recently, revenue streams have mainly consisted of income from in-app advertising. In addition to this, there is a premium version where paying users can get additional functionalities. That business accounted for around 20 percent of revenues in 2020. During the fall of 2020, Truecaller launched a corresponding offering that targets corporates. This part of the business allows B2B customers to be listed as verified callers when they call private people. It can for example be a security company that calls about an alarm or a courier company that needs to get in contact with a receiving customer. It is a common problem that these types of companies get rejected when the call-receiver doesn’t recognize the number.
Truecaller declares that their product benefits from network effects. i.e., the product gets better the more people who use it (think Facebook). This can be relatively easy to appreciate since phone number identification inherently evolves from reporting of unwanted calls by the users, i.e., when enough people have reported an unwanted call Truecaller flags for this in the app). Over time, Truecaller has built a database containing 5.7 billion unique phone-identities. Network effects doesn’t just build a better product over time, they also increase the entry-barriers for potential competition.
The majority of Truecaller’s income comes from developing countries. The company explains that the problems related to spam emails, harassment, unwanted calls, and messages are more common there than in the western world. India is Truecaller’s largest market where these types of problems are significant. One positive aspect of the geographical exposure is that it allows for a nice structural tailwind: the population growth in developed markets is much higher than in the west (driven by an increasing average age) and the smartphone penetration is growing fast.
Historically, 97 percent of all app downloads have been organic. However, management has begun to experiment with user acquisitions by the way of advertisements through, for example, Facebook. The returns on user acquisition looks extremely attractive. In some markets, such as India, Truecaller could achieve a return on investment of up to 20x on every spent dollar. In more mature markets, such as the USA, the same multiple amounts to 4x, still very attractive. Indonesia, which is a relatively new market to the company, has a multiple of 0.8x. This means any user acquisition spend in Indonesia is unprofitable at this point. However, management is confident that the return profile will wander above the 1x as more users join and the network effects take place. In summary, the investment opportunities are plentiful and attractive – and unique.
In summary, several things speak for significant growth in the future. The investment in paid user acquisition, a sharpened premium-offer, the newly launched B2B product and continued growth of the advertising business. In addition to this, acquisitions may likely follow.
Growth has been prioritized over profitability and it is only recently that the company began to report profits. In 2019 sales grew by 57 percent. In 2020 the corresponding figure was 64 percent, and during the first half of 2021 the company’s sales grew with as much as 151 percent in comparison to the same period last year (which was partly affected by the pandemic). During the first half of this year, the company’s operating margin was 32 percent. As you can imagine, Truecaller is very capital-efficient. Working capital is very low which gives a nice cash conversion and a very high return on capital employed – all attributes that are required to create a very successful and valuable company over time.
Truecaller targets a revenue growth of at least 45 percent between 2021-2024e. After 2024 the EBITDA-margin should be at least 35 percent. The sum of the year-on-year growth and the EBITDA-margin should amount to at least 70 percent (a variant of the rule of 40 that tries to balance growth and profitability). We don’t think it will be difficult to reach these targets and the analyst estimates we have looked at are cautious, especially regarding profitability. In our preliminary prognosis for 2023, our EBITDA-estimate is around 16 percent ahead of the analyst estimates that we’ve studied. This is based on that Truecaller can continue to grow sales much faster than hiring new people while the gross margin improves slightly in coming years.
The gross margin is an interesting aspect of the equity story. Truecaller’s gross margin amounts to approximately 70 percent. Most of the cost of sales consists of platform fees to Apple and Google. Since Apple and Google practically control the distribution channels for apps together, a duopoly has occurred and prices for app-developers such as Truecaller have remained high around 25-30 percent of sales. This situation is now heavily criticized from all parts of the world since the situation is not considered competitive, for example
look at this analysis about an American court ruling concerning a twist between Epic Games and Apple. We believe Google and Apple’s fees will decrease over time – which would be a positive event for Truecaller. Furthermore, Truecaller’s new business deal bypasses Goggle and Apple, which gives a gross margin of close to 100 percent. This will strengthen the profitability even more.
There are of course risks associated with the dependence on Google/Apple (which is the case for every company in the application business); the geographical exposure and one should never write off the threat of competition even if it seems far away at this stage. However, we do believe the benefits outweighs the negatives. Truecaller has excellent financial characteristics, operational founders with large shareholdings who will remain active in the business and some of the world’s most well-known investors behind it. We therefore look forward to being included as an anchor investor ahead of the stock exchange listing on October 8th. We are even more excited to follow the company’s successes in current and new markets in the coming years.
CVS Group
One of the happiest days of the month was when our veterinarian company CVS Group released their interim numbers. Once again, the company beat analysts’ expectations which have been raised several times over the course of the year. In the first two months of the new financial year (which begins in July), the company has grown by 17 percent. This can be compared with the growth expectations for the full year which, before the report release, were 7 percent. Once again, analysts have thus far been “forced” to upgrade their assumptions. In a sour September stock market, the share fell 3 percent.
It becomes clear that the positive effect of the pandemic on pet ownership is more tenacious than ever. Pets live for many years, and we believe many underestimated the importance of the large number of new customers during the pandemic. Below is a graph of Google searches for veterinarians in the UK as well as data from the Swedish Board of Agriculture regarding the number of newly registered dogs. We speculate that the UK has similar trends as Sweden. The data points are also positive for our other pet company Swedencare. Pet companies are obviously still hot; right now there’s a bidding war going on over the German pet company Zooplus, where EQT is currently in the lead with the highest bid. We also note that there have been several venture capital-led acquisitions of veterinary companies at higher multiples than CVS is valued at.

Source: Jordbruksverket, Coeli

Source: Google Trends, Coeli
Lindab
Since our first investments in Lindab in the autumn of 2019, the thesis has always been that the building systems business segment did not fit into the business and in September, management finally found a buyer for the company. The transaction entails a write-down of goodwill corresponding to SEK 430 million, but it is cash flow neutral. Lindab took the opportunity to update its financial targets; the company now wants to grow by 10 percent per year (of which approximately two thirds are through acquisitions) and reach an operating margin of at least 10 percent (previously 10 percent over a business cycle). The share responded positively to the message.
We noted broad insider purchases in Lindab during the month, also from CEO Ola Ringdahl himself, which we think bodes well for the report in October. Despite this the share price decreased 8 percent in September.
Victoria
We have written several times about the British flooring company Victoria, which in September had a weak share price development of 17 percent. By all accounts, the company is doing well – during the month it was reported that sales rose 70 percent compared to 2020, and 50 percent compared to 2019. If you only partially extrapolate these figures for the rest of the year, it is obvious that analysts’ expectations are too low. We believe that this month’s decline is related to flows: growth companies and small and mid-cap companies were some of the most affected sectors in September – Victoria was hit from both sides. We have increased our position in recent days.
The Pebble Group
One of the month’s (few) joys was Pebble Group. As we previously wrote, the company is active in the market for gift advertising, i.e. gifts that companies give to customers, employees, and other stakeholders for marketing purposes. In September the company came out with its half-year figures that were better than expected. Pebble’s software division, Facilisgroup, is growing better than our expectations. This is also the part we believe the market is valuing too low. The stock rose 10 percent in September.
Knaus Tabbert
During the last trading day in September, our German motorhome manufacturer Knaus Tabbert announced that the forecasts for 2021 must be lowered due to component shortages. We are not particularly surprised that this has happened given what we have seen from other vehicle manufacturers. If the company can remedy these supplier problems, management believes that 2022 will be unaffected at best, as Knaus still has a bursting order book, increased production capacity and more suppliers from January next year. The share fell 7 percent in September.
Short positions
The short portfolio contributed with a negative result during the month. Our short-term negative positions in the German DAX had the largest negative contribution. Some stock specific short positions that contributed positively to the result were Swedish Dometic, German Henkel and Norwegian NEL.
Exposure
The net exposure, adjusted for our unlisted holdings, at the beginning and end of the month was 76 and 74 percent, respectively.
Summary
September's negative return of x percent also meant the end of the fund's, so far, longest period of positive return (10 months). We are obviously disappointed with that, but we have been in the game long enough to understand that equities sometimes must fall to be able to refuel and continue their upward trajectory. In general, September was the weakest month for many equities since the crisis started 1.5 years ago. September, otherwise, started strong for us and was a continuation of an unusually good performance at the end of August. Our companies presented many good news (except for Knaus Tabbert on the last day of the month) but small-caps and especially those categorized as growth shares, had a very weak performance during September. The main reason for this was, as previously mentioned, the change in the US long-term interest rate and general "risk off".
The picture below shows the development since March last year compared with the corresponding time intervals in the financial crisis in 2009 and onwards. Both periods have shown an unusually strong recovery and the current trend is even stronger than when the financial crisis raged 12 years ago.

Source: Goldman Sachs
Since the crisis started 1.5 years ago, we have had three different phases. The first and shortest, "despair", showed a decline in prices of 33 percent. The second phase, "hope", ended at the beginning of this year and showed a very strong return of 79 percent despite declining earnings. The last, “growth”, where we are now, has shown +11 percent in share prices with sharply rising growth for companies' earnings, but at lower valuations.

Source: Goldman Sachs
The recovery for American companies (below) has been extremely strong and compared to 2019, the 2021 profits will be approximately 36 percent higher. Very impressive.

Source: Goldman Sachs
It is very gratifying that Europe, for once, is keeping up with the United States and showing strong profit growth. Compare this with the non-existent profit growth between 2007–2019 (!)

Despite rising equity prices, valuations have fallen and Europe is now trading around 16x the profit 12 months ahead. It's not very strenuous (we think). For an average commercial property, you can get a return of maybe 3 percent before net financial costs. After financing, this corresponds to at least P/E 50x. And paying to lend to different countries does not feel like an exciting alternative either.

Source: Goldman Sachs
The valuation of global shares in relation to global GDP looks more strained. A major reason for this is the central banks' aggressive policy.

The valuation of the major leading technology companies is at an average level seen from the last five years.

Source: Goldman Sachs
The image below is striking. It shows that Swedish property prices, which have risen by almost 200 percent over the past 15 years, have had the same development as the money supply. In theory, price per m2 and krona is unchanged for the past 15 years. Is there anyone who still doubts that the world's central banks are responsible for the largest wealth creation in human history? It is important to be on the wagon because when it is gone you’ve missed it. And what central banks cannot push, the price of bitcoin for example, rises even more as central banks cannot make more of it. The opportunities for central banks to reverse the band are few. In the long run, this means that the next 10 years will, overall, be a good period for, for example, stock picking. All forms of uniqueness (growth) will be highly valued to compensate for the fact that the value of money decreases at a rapid pace.

If there is anyone who is still not convinced, take a look at the picture below. The market capitalization of the S&P500 divided by the Fed's balance sheet….

Source: Bloomberg
Onwards and upwards. The wealth of American households is accelerating away from the change in GDP.

Thank you Fed and all the world central banks!

Citigroup's surprise index has weighed down and analysts' profit estimates are also starting to soften. Not a good combination and it has undoubtedly contributed to the weak development in the stock markets recently.

It took a full 219 days for the S&P500 to have a decline of 5 percent. We will see how high the next bar will be.

Timing is everything. A fascinating graph that shows the importance of having reasonable timing in decisions.

Source: Goldman Sachs
Despite a difficult month behind us, it feels reasonable to expect a stronger market during the last quarter of the year. Our view is that we are still in a rising market, although we are likely to experience some turbulence for a few more weeks. "Bear markets" are constantly declining with sharp rallies while "bull markets" continue to rise with some strong drawdowns. We therefore believe that we are still in a rising market.
Some statistics to cheer you up. The S&P500 managed to rise by 0.2 percent in the third quarter (Europe -1.9 percent) which means six consecutive positive quarters. This has only happened eight times before and only on one of the (eight) occasions has the following quarter yielded a negative return. Two quarters later, it has in all cases yielded a positive return. In addition, for the past 20 years, October has been the fourth best month, thus much better than its reputation. Having pointed that out, October takes first place in terms of most frequent daily movements that exceed one percent.
The Stockholm Stock Exchange, which is an excellent reference point, had risen by 30 percent at its highest about a month ago, but is currently at 20 percent. Even more important is that measured in USD, OMX has "only" risen by 13 percent, which is in line with the US stock markets. This is hardly excessive given the profit growth among the companies. The risk premium in the market is high.
Investors are reasonably careless, and we are approaching the turn of the year. Global growth is well above average and interest rates are extremely low. Given how cruel the market has been to many investors this year, with sector rotations and a high concentration of companies driving performance, it almost feels obvious that the broad mass of investors will continue to reduce risk in their portfolios and then be short equities at year-end when the market rises. We'll see, but that's our main scenario right now.

We are now closing the books for the third quarter, and we look forward to the end of the year and above all the entrance for Truecaller on the Stockholm Stock Exchange on October 8!
Thank you for this month and we'll hear from you later.
Mikael & Team
Malmö on 5 October
[/et_pb_text][et_pb_text admin_label="Coeli Nordic Corporate Bond Fund R-SEK" _builder_version="3.0.89" background_layout="light" module_class="gen-table-module" disabled_on="on|on|on" disabled="on"]
Coeli Nordic Corporate Bond Fund
| Performance in Share Class Currency | 1 Mth | YTD | 3 yrs | Since incep |
| Coeli Nordic Corporate Bond Fund - R SEK | 1.30% | -0.93% | 3.38% | 14.52% |
| | | | |
[/et_pb_text][et_pb_text admin_label="Coeli Nordic Corporate Bond Fund R-SEK" _builder_version="3.0.89" background_layout="light" module_class="gen-table-module" disabled_on="on|on|on" disabled="on"]
[cg_linear_graph id="31122"]
[/et_pb_text][et_pb_image _builder_version="3.0.89" src="https://coeli.com/wp-content/uploads//2020/10/ncbr.png" show_in_lightbox="off" url_new_window="off" use_overlay="off" always_center_on_mobile="on" force_fullwidth="off" show_bottom_space="on" disabled_on="on|on|on" disabled="on" /][/et_pb_column][et_pb_column type="1_3"][et_pb_image _builder_version="3.0.89" src="https://coeli.com/wp-content/uploads/2019/01/Gustav-Fransson6.jpg" show_in_lightbox="off" url_new_window="off" use_overlay="off" always_center_on_mobile="on" force_fullwidth="off" show_bottom_space="on" custom_margin="||21px|" disabled_on="on|on|on" disabled="on" /][et_pb_text admin_label="Namn och title" _builder_version="3.0.89" background_layout="light" module_class="gen-single-ingress-module" custom_margin="||40px|" disabled_on="on|on|on" disabled="on"]
Gustav Fransson
Portfolio Manager of Coeli Nordic Corporate Bond Fund
[/et_pb_text][et_pb_image _builder_version="3.0.89" src="https://coeli.com/wp-content/uploads/2018/10/Alexander-Larsson-Vahlman.jpg" show_in_lightbox="off" url_new_window="off" use_overlay="off" always_center_on_mobile="on" force_fullwidth="off" show_bottom_space="on" custom_margin="||21px|" disabled_on="on|on|on" disabled="on" /][et_pb_text admin_label="Namn och title" _builder_version="3.0.89" background_layout="light" module_class="gen-single-ingress-module" custom_margin="||40px|" disabled_on="on|on|on" disabled="on"]
Alexander Wahlman
Senior Analyst
[/et_pb_text][et_pb_text admin_label="Fund Overview" _builder_version="3.0.89" background_layout="light" custom_margin="||20px|" module_class="gen-trustee-single-table"]
Fund Overview
| Inception Date | 2017-12-20 |
| Investment management fee (share class I SEK) | 1.00% p.a + 20% Performance fee (OMRX T-Bill Index) |
| Performance Fee. Yes | 20% |
| Risk category | 5 of 7 |
[/et_pb_text][et_pb_text admin_label="Top Holdings (%)" _builder_version="3.0.89" background_layout="light" custom_margin="||20px|" module_class="gen-trustee-single-table" disabled_on="on|on|on" disabled="on"]
Top Holdings (%)
| LANSBK 1.25% 18-17.09.25 | 4.1% |
| NORDEA HYP 1.0% 19-17.09.25 | 4.1% |
| SWEDBK 1.0% 19-18.06.25 | 4.1% |
| WHITE MOUNT FRN 17-22.09.47 | 3.9% |
| B2 HOLDING FRN 19-28.05.24 | 2.9% |
[/et_pb_text][/et_pb_column][/et_pb_row][/et_pb_section][et_pb_section bb_built="1" fullwidth="off" specialty="off" _builder_version="3.0.89" module_class="gen-trustee-single-yield-section gen-pattern-section" custom_padding="0px|||"][et_pb_row _builder_version="3.0.89" custom_padding="||53px|"][et_pb_column type="4_4"][et_pb_text admin_label="VIKTIG INFORMATION" _builder_version="3.0.89" background_layout="light" module_class="gen-trustee-single-warning-blurb"]
IMPORTANT INFORMATION. This is a marketing communication.
Before making any final investment decisions, please refer to the prospectus of Coeli SICAV II, its Annual Report, and the KID of the relevant Sub-Fund. Relevant information documents are available in English at coeli.com. A summary of investor rights will be available at
https://coeli.com/regulatory-information-coeli-asset-management-ab/.
Past performance is not a guarantee of future returns. The price of the investment may go up or down and an investor may not get back the amount originally invested.
[/et_pb_text][/et_pb_column][/et_pb_row][/et_pb_section]