[et_pb_section bb_built="1" fullwidth="off" specialty="off" _builder_version="3.0.89" background_image="https://coeli.com/wp-content/uploads//2018/08/malmo-bro-comp.jpg" parallax="on" module_class="gen-trustee-single-hero"][et_pb_row][et_pb_column type="4_4"][/et_pb_column][/et_pb_row][/et_pb_section][et_pb_section bb_built="1" fullwidth="off" specialty="off" _builder_version="3.0.89" custom_padding="0px||0px|"][et_pb_row][et_pb_column type="4_4"][/et_pb_column][/et_pb_row][et_pb_row _builder_version="3.0.89" background_position="top_left" background_repeat="repeat" background_size="initial" custom_padding="0px|||" custom_padding_phone="23px|||" custom_padding_last_edited="on|tablet" module_class_2="gen-trustee-single-sidebar" module_class="gen-single-news-content-row "][et_pb_column type="4_4"][et_pb_text admin_label="Tillbaka-knapp" _builder_version="3.0.89" background_layout="light" border_style="solid" custom_margin_tablet="||17px|" custom_margin_last_edited="on|desktop" module_class="gen-back-button hide-in-print"]
Note that the information below describes the share class (I SEK), which is a share class reserved for institutional investors. Investments in other share classes generally have other conditions regarding, among other things, fees, which affects the share class' return. The information below regarding returns therefore differs from the returns in other share classes.
Before making any final investment decisions, please read the prospectus, its Annual Report, and the KID of the relevant Sub-Fund here
[/et_pb_text][et_pb_text admin_label="Tillbaka-knapp" _builder_version="3.0.89" background_layout="light" border_style="solid" custom_margin_tablet="||17px|" custom_margin_last_edited="on|desktop" module_class="gen-back-button hide-in-print" border_style_all="solid"]
This material is marketing communication
[/et_pb_text][et_pb_text admin_label="Datum / Skriv ut" _builder_version="3.0.89" background_layout="light" border_style="solid" custom_margin_tablet="||17px|" custom_margin_last_edited="on|desktop" module_class="gen-single-news-date-module gen-trustee-print-module hide-in-print" locked="on" border_style_all="solid"]
[blog_post_date]
Print
[/et_pb_text][et_pb_text _builder_version="3.0.89" background_layout="light"]
Monthly Newsletter Coeli Absolute European Equity – December2022
DECEMBER PERFORMANCE
The fund’s value decreased by 1.7% in December (share class I SEK). The Stoxx600 (broad European index) decreased during the same period by 3.4% and HedgeNordic’s NHX Equities decreased provisionally by 0.8%. The corresponding figures for 2022 are a decrease of 30.1% for the fund, -12.9% for the Stoxx600 and -5.0% for NHX Equities.


EQUITY MARKETS / MACRO ENVIRONMENT
The strong development that began on November 10th, ignited by low US inflation data, was abruptly cut short when the ECB raised its key interest rate by another 50 basis points on December 15th. The day before, the FED had announced its interest rate hike, which was generally well received. The Fed's interest rate hike rate decreased and there were no negative surprises. The president of the ECB, Christine Lagarde, on the other hand, had a much more hawk-like use of language. The message was that the policy rate is expected to rise
significantly from current levels as inflation is far too high and is expected to be so for far too long. This meant that the broad European index fell by just under three percent that day, and the more cyclical German index fell by nearly four percent.
On the same day, the Bank of England held a meeting where they raised the key interest rate for the ninth time this year. However, the executive board was non-consensual, which immediately weakened the British pound (again). During the day, the British pound fell by 1.5 percent against the euro and by 2 percent against the US dollar. It is a huge movement in the currency world. That day, the much-anticipated Santa Claus Rally plummeted. Measured in local currencies, the decline in December was 3.4 percent for the Stoxx600, 2.8 percent for the OMX, 5.9 percent for the S&P500 and 9.1 percent for the Nasdaq. The fund's development during the same period declined by 1.7 percent.
The stock market in 2022 has basically been completely dictated by the inflation trend and thus rising interest rates. December was no exception but was more like a crescendo of the year that had passed. It is clear that the ECB's polemics and language used on 15 December was a political fog curtain to try to hide its grave mistakes made in recent years. Having said that the best prognosis is that they will react too late this time too, with an obvious risk of unnecessarily creating an avoidable large economic damage in parts of the European economy.
Study the image below and think about what made the ECB: a) keep interest rates high for far too long in 2008 before Lehman crashed b) had zero interest rates until 2015 and then negative interest rates for seven years c) why for the first time in 11 (!) years started raising the key interest rate only in July this year (!). When you have thought it through, you add to that that the ECB's primary goal is to
maintain price stability. The policy rate is now 2.5%, inflation around 10% and the grim conclusion is that most things have gone wrong in recent years.

A more positive development is that inflation in the US is clearly declining. As recently as last summer, the view was that inflation was out of control. The other day we noted inflation forecasts from the Federal Reserve Bank of Cleveland. Their models indicate that consumer prices are now at a low rate of 0.12%, which simply means an annual rate of a low 1.4%.
Read more
It strengthens our belief that inflation in the coming months will drop sharply and our humble guess is that we can be down around three to four percent by summer. IF that turns out to be true, European inflation is likely to follow with a lag of about six months and in that case the ECB (and the Swedish Riksbank) have once again been monumentally wrong in their forecasts.
Our increased exposure to the real estate sector clearly indicates what our view is, and, in a few months, we will know significantly more. A factor that is likely to have a negative impact on the reduction in the inflation rate is that the globalization trend is waning while green conversions / investments can contribute to rising inflation.
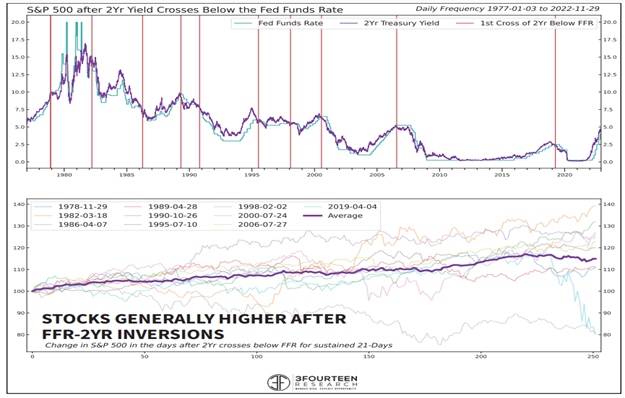
The US two-year interest rate has fallen recently and is now below the Fed's policy rate. Historically, this has signalled a shift in the FED's policy, which in turn has been positive for both bonds and stocks.
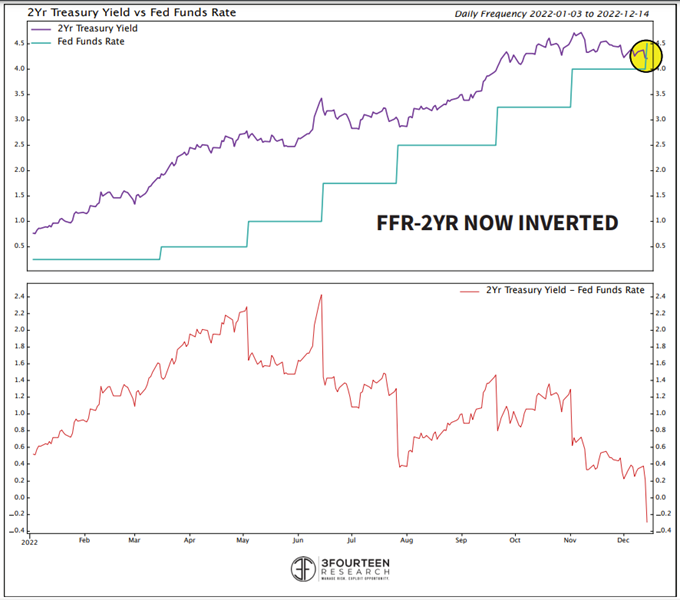
Source: 3Fourteen Research
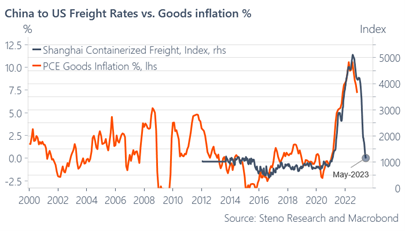
The figure below shows the correlation between a Chinese freight index and US commodity inflation. If the correlation turns out to be positive, inflation will be down around zero percent in May.
The picture below on the left shows the key interest rate for the USA and Europe and on the right the Goldman Sachs financial index where you can now see that the condition has eased somewhat in the USA.
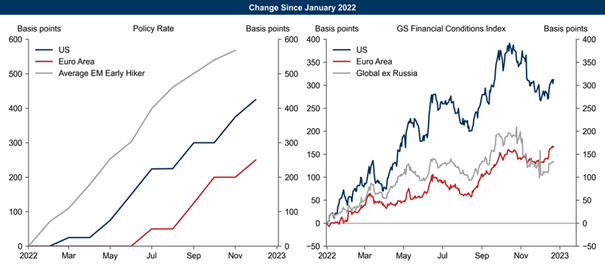 Source: Goldman Sachs
Another positive development aside from falling inflation is the resilience of the European economy. During December, the German Ifo index was published, which showed an improvement compared to the previous month. The probability of a European recession remains high, but it need not be either prolonged or deep. Compared to, for example, the financial crisis, the engine of the economy, the banks, is in significantly better condition.
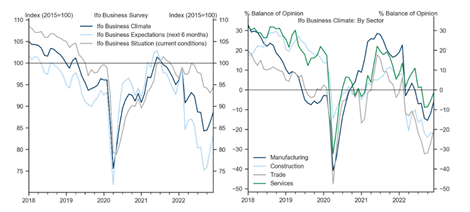 Source: Goldman Sachs
The US economy is also holding up well and Goldman Sachs gives only a 35% probability that the US economy will enter recession within 12 months. That must be considered a positive!
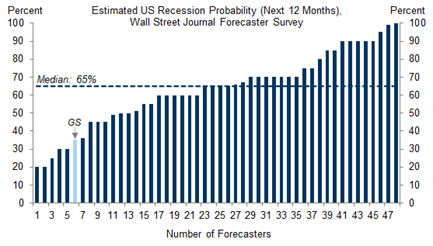
Is the recession discounted?
 Source: Twitter
First the soldiers fell and in December the generals capitulated. Apple and Microsoft's share prices fell 13.3% and 7.3% respectively in December, while Tesla fell by as much as 38%. Elon Musk thus became the person in world history who lost the most money in the shortest time. However, he is still the world's second richest, but was surpassed in December by Bernard Arnault, founder and main owner of LVMH.
It is telling that on the first two days of the year in 2023, the broad European index had risen by just over two percent, while Apple's share price fell by just under four percent and Tesla's by as much as 12%. If you study the profit growth for these large companies, it is not so strange. Apple and Microsoft are expected to have profit growth of a few percent while the multiple exceeds 20x. Just a few years ago, when growth was strong, companies traded around 15-17x earnings and interest was lower. Notice the table below on the far right. We use x instead of percent when calculating the return and measure the return up to one year ago. There will be too many numbers otherwise, and one can conclude that a lot of wealth has been created.
 Source: Coeli European
Apple's stock price compared to Alibaba and JD.Com. The latter two are giant Chinese online shopping companies. Apple's share price has fallen by 17% in two months, while Alibaba and JD.Com have risen by 67 and 80%, respectively! Apple has been loved by everyone and Chinese companies the other way around, until recently.
 Source: Themarketear.com
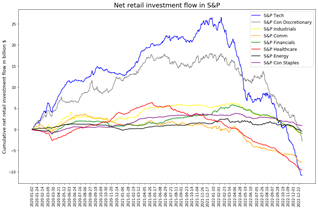
American private investors as a collective are the largest owners of American stocks. Since the spring of 2022, they have sold enormous amounts of technology shares (blue line) and, according to Goldman Sachs, have now net sold everything they bought since covid broke out almost three years ago. When does it turn?
 Source: Goldman Sachs
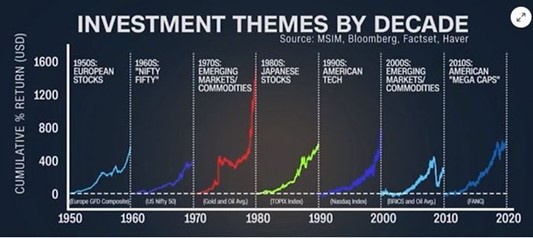
Thanks for the show! An extremely relevant question is what the theme should be for the next 10 years? Technology is likely involved in some way, but energy is also close at hand. Right now, 60 nuclear power reactors are being built in the world (440 are in operation). Of these, one is built in Slovakia, one in France and two in Great Britain. The remainder is mainly built in China, Russia, India and the rest of Asia. A further 100 are planned and 300 are proposed. It feels like an interesting sub-sector. The antipode of that, Sweden, the elected officials have chosen to shut down 6 out of 12 nuclear power plants, with enormously negative consequences for society. Traditional oil companies continue to trade at very low multiples, despite having developed very strongly in 2022. Green energy stocks will continue to be interesting, but often have high expectations priced in, which makes future returns more uncertain.
 Source: MSIM, Bloomberg, Factset, Haver
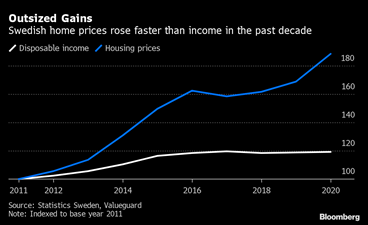
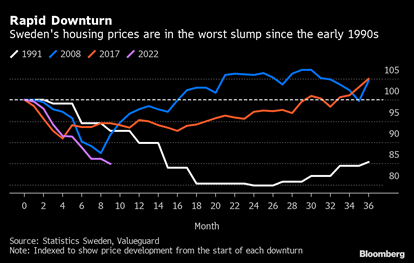
Unfortunately, Swedish citizens are among those who stand out globally in terms of vulnerability in the private economy. Sweden is international front-page news and international economists follow developments closely. Our house prices have risen more than in most other comparable countries and we are at the top in terms of loan-to-value in relation to disposable income and a high proportion of variable loans. Forecasters are now starting to think about whether the 20% expected price drop in the forecasts is enough (-17% since March 2022). The decline in the market in the early 1990s, when housing interest rates were close to 15% and the key interest rate for a few days at 500%, ended at -20.6%.
Although interest rates are still at low levels today, it is a big problem for many when the interest rate has now risen 3x in a short time. However, the real interest rate is still at very low levels (-6-7%) and at the same time inflation is eating up part of the debt. What used to be called non-durable goods (because you bought these goods less often) is going to decrease somewhat. With around 5000 billion in housing loans, it will cost the government a lot of money when the interest subsidies also rise 3x. The interest subsidies should now be around 50 billion at an annual rate (own estimate) and it was of course economic madness not to reduce the interest subsidies when we had zero interest.
Swedish real estate prices are so far maintaining the same rate of decline as during the 2008 financial crisis (purple line). This time the Riksbank will not lower rates but, on the contrary, will raise them further.
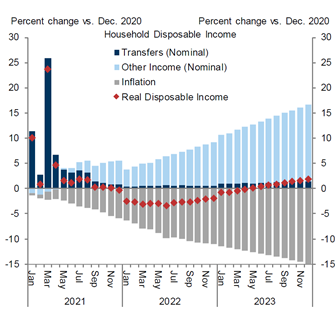
But after sun comes rain! Below Goldman Sachs estimates for the development of disposable income for the average American. Falling inflation, increased contributions and falling interest rates mean that the situation is expected to improve after the summer. For Europe, the big problem is energy costs, but Europe's politicians are likely to routinely increase national debt and give subsidies to appease their voters.
 Source: Goldman Sachs
The warm weather in recent weeks has contributed to a collapse in European gas prices which is extremely welcome for Europe and prices are now at the same level as a year ago. Very good for both consumers and producers and, not least, it gives Europe extra time to build up reserves for next winter 2023–24. The following year, the supply increases, mainly from new capacity from Qatar, and things then look significantly better
 Source: Bloomberg
Europe's political leaders caught up a few weeks ago when it was announced that they had agreed on a price cap on gas prices that will come into effect on February 15. The price ceiling is set at 180 euros per MWh. If it had been in place this summer, it would not have been possible to fill up the stock levels before the winter, and Europe would probably have already experienced major problems with electricity supplies to residents and businesses. The price ceiling thus limits Europe's ability to pay what is required to ensure the volumes before 2023. Another engraved and hard-to-understand solution by Europe's power elite. You have a deficit on something and at the same time you think you can dictate the price!
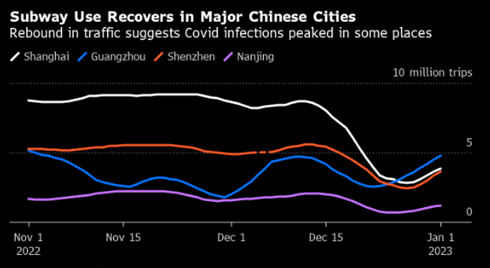
President Xi Jinping conceded defeat to Covid-19 after violent protests among citizens, and after a huge U-turn by Chinese leaders, society quickly opened up in December. It was all very unusual for China and suddenly Chinese could start traveling again. On the first two planes that arrived at Malpensa in Milan, 50 percent were infected and a certain feeling of déjà vu crept in. The image below shows that traffic in some major Chinese cities increased in the last week of December. The continued development here will have a major impact on global growth after almost three years of lock downs (to varying degrees).
 Source: Bloomberg
In Germany on December 7
th, 3,000 police officers took part in a crackdown on armed right-wing extremists who were planning a coup d'état! Terrible and crazy. The biggest crackdown on extremists ever in Germany. Democracy is unfortunately under great pressure in many parts of the world.
Relations between China and the United States are more strained than in a long time. In December, however, China and Saudi Arabia concluded a global partnership where Saudi Arabia will now start trading its oil on the Shanghai stock exchange as a first step. Both countries have, to say the least, fuzzy concepts of morality and go against the values of the entire Western world. Cheap oil from Saudi Arabia fuels the Chinese economy while China helps Saudi Arabia with technology including weapons. This probably means that the old US-Saudi Arabia axis pact is now weakening, and arms purchases from the USA (Saudi accounts for 12% of all world arms purchases!) have already decreased. It is hardly a long shot that China is prepared to help meet and thus the world order is moved a little further towards the East. Asia's population amounts to approximately 4.5 billion compared to just over a billion for Europe and the United States combined.
Finally, we unfortunately have to state once again that the Swedish krona became the worst western currency in 2022. During the year, we have all become 8% poorer compared to our European surroundings. Since 2013, the Swedish krona has decreased in value against the euro 8 out of 10 years. One euro cost SEK 8.30 in 2013 and now SEK 11.25, which is roughly 35% more.
All other things being equal, this means that investments in Sweden by the margin decrease, inflation rises via imports and qualified labour chooses to move abroad. There will be holidaying in Romania and Turkey in the future. The average salary in Denmark and Norway is at least 20-30% higher than in Sweden. We have turned into the poor cousin of the country and our elected officials stick their heads in the sand or don't understand better. At the same time, the Riksbank has sold large amounts of kronor during 2022, which contributed to the weakening and thereby increased inflationary pressure. The whole thing is like reading a Franz Kafka novel.
 Source: BloombergLong positionsPets at Home
2022 was a year when consumer stocks were one of the worse categories of stocks to own. Perhaps worst of all fared the British consumer shares. Goldman Sachs' basket of UK consumer stocks fell 45% in 2022. The country has been particularly hard hit by gloomy inflation headlines. The weak pound has also made imports more expensive. And it didn't help with the uproar in Parliament, where Liz Truss's tax proposals raised inflationary fears quite unnecessarily.
You can often create excess returns by buying the finest companies in unloved sectors. We believe that the pet company Pets at Home is one of those. We picked up our first shares in September above £3.20. It turned out to be too early because the share then fell sharply in the weak stock market that started in the autumn. We seized the opportunity and increased our position sharply, bottoming out at levels around £2.64. The stock has recovered somewhat and was one of the fund's strongest contributors in December, rising 8%.
The biggest concern the market has regarding Pets at Home is whether people can afford to continue buying pet-related products. The company's management usually emphasizes that the majority of revenue comes from products that have a repetitive nature, for example animal feed or cat litter. The remaining part consists of more profitable product categories such as dog toys. These revenues will be less in 2023. But we do not think that the effect will be particularly large when Pets at Home also has a large veterinary business that will grow nicely next year. We believe the veterinary leg constitutes a third of the operating profit before group costs this year.
So far this year, they have managed to maintain growth. Comparable growth has been just over 6% in the first six months of the fiscal year ending in March. In previous recessions, the pet industry in particular has done well. In the last quarter, it even welcomed more new customers to the company's membership club for owners of kittens and puppies than it did during the pandemic. The management recently flirted with the idea that people will continue to buy pets after the pandemic as it is now known that employers are allowing work from home to a greater extent. We'll see if that thesis holds up.
In the short term, we are more concerned about the cost situation. Rising energy costs, wage inflation and a weak pound will make it tough for many retailers in 2023. Pets at Home is no exception. However, much of our concerns seems to be accounted for in the analysts' estimates today. Moreover, these are external problems that are largely (hopefully!) temporary in nature.
If you dare to take a step back, you will see a company that has amassed strong market share for several years. The company should be able to sustainably grow by more than five percent per year. This at a return on capital employed that exceeds 25%. The cash flow generated can be reinvested in store renovations at a good return.
The charm of the business model is that the company's store operations feed the veterinary operations and vice versa with traffic.
The stock now pays a low EV/EBIT of 8x on our estimates ending March 2025. A low multiple of 10x gives a potential of around 37% over 1-2 years. If we assume a multiple of 12x, the return instead lands at around 60%.
Commerzbank
The fund's best contributor in December was the German Commerzbank, whose share rose by just over 10% and thus contributed around 0.5%. It is one of the fund's most recent investments, as we started investing as late as mid-November after the stock was curiously under significant pressure following their quarterly results. The share then traded around 7.50, closed the year at 8.84 and is currently trading around 9.50.
The investment thesis was and continues to be, a combination of rising earnings as interest rates rises, a significant restructuring which contributes to strong profit growth in the coming years and that the bank can also be included in the German bank consolidation and then in the form of a takeover. The share rose 32% in 2022 but is still valued at low levels. The P/B for 2023e and 2024e is around 0.40 and the corresponding P/E numbers are just over 7x and 6x, indicating continued significant potential. In connection with the purchase of Commerzbank, we sold our holding in Nordea.
Corem
During December, we built a position in the Swedish property company Corem. The stock was among the worst performing real estate stocks in Europe in 2022, down nearly 75%. A large part of the explanation for this is Corem's bond maturities of SEK 11.4 billion 2023-2025, which of course have become significantly more expensive and more difficult to refinance in recent quarters. In addition, the main owner Rutger Arnhult has been under considerable financial stress, which has further had a negative impact. Corem is now embarking on a major restructuring where we think we see a stable underlying cash flow that the market seems to be overlooking.
The restructuring program got off to a good start when at the end of last year, they sold properties worth nearly 7 billion (in total they owned properties worth 81 billion at the end of the third quarter). A significant portion of the sale proceeds will be used to settle upcoming bond maturities and we expect the restructuring to continue this year. Worth noting in this context is that only 25% of Corem's debt is bonds, which is less than many other listed real estate companies, and that the amounts in relation to the total loan market are not significant. The equivalent for, for example, Balder is 60% and 74 billion. Corem has a reasonably stable and strong cash flow and the share costs around SEK 10 compared to the latest net asset value of just under SEK 30 which, in our opinion, today's valuation does not reflect.
Private Investments
After updating our valuation model in December, we chose to reduce the valuation of Rejuveron by approximately 10%. The main reason is rising interest rates. Our initial investment was made three years ago at CHF 19 per share. Last spring, the company took in more capital at CHF 120 per share and added additional capital at the same valuation in July. Our holding is now booked at around CHF 90 per share. Our Bullish holding went in the opposite direction after we exercised a repurchase clause at a premium. Our investment was made at $100 per share and the valuation rose to $114 per share. The total negative contribution was approximately 0.6 percent in December.
Short positions
The short portfolio contributed with a positive result during the month. The biggest contribution was made by our short positions in a Swedish small company index and in the larger Swedish OMXS30 index.
Exposure
The net exposure, adjusted for our unlisted holdings, at the beginning and end of the month was 79% and 72% respectively.
Summary
With the conditions that were presented in December, we are reasonably satisfied with the month. The fund fell by 1.7% which includes a write-down of a total of -0.6% in our unlisted holdings. In addition, the performance was affected by a record weak Swedish krona and the weak British pound. The aggregate negative contribution from currencies in December in isolation was approximately -0.8% and underlying performance for our holdings was therefore, in a market which fell by 3.4%, approximately -0.2%.
We have left a heavy and challenging year behind us. The war has made us all sad and it has contributed to high volatility and stress in the financial system, which in turn has greatly affected the fund's performance. We are of course deeply disappointed with last year's returns and our big mistake was not being aggressive enough in the first quarter to sell out previous years' winners. The common denominator for these companies was simplified: smaller companies with a strong return over a longer period of time, high multiples and growth companies. As much as 60% of last year's total loss came during January and February.
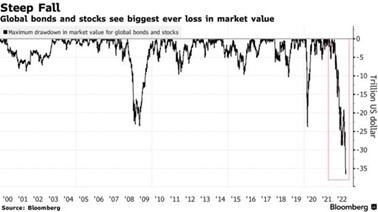
On the global stage, losses in total value were greater than ever before. Both stocks and bonds had an extremely weak year.
Since then, we have worked methodically to change the structure of the portfolio. Compared to a year ago, the portfolio is significantly different with a materially higher exposure to larger companies with lower valuations and more predictable earnings. A third of the fund's capital is currently invested in ISS, Tate & Lyle, Accelleron, BoneSupport and Commerzbank. With the exception of BoneSupport (growth company), the absolute valuation is low (Tate & Lyle) or very low (ISS, Accelleron and Commerzbank). A year ago, the largest holdings for the fund were: CVS, Lindab, Victoria, Surgical Science and Truecaller. Lindab continues to be a significant holding for the fund, and we have been an owner since summer 2019.
Volatility for the fund has gradually decreased during the fourth quarter, while the return has improved. In addition to the gradual improvement of the market, it leads us to believe that our adjustments to the portfolio were correct. We also note, with a large dose of humility, that as weak as last year started for the fund with 6 negative days in a row, this year has started just as strongly. But at the time of writing, we have only harvested one percent of the trading year.
With all the above said, how do we see 2023? It will be significantly better than 2022 is the short answer. So far, the decline in the stock market has been almost exclusively about valuations coming down. The companies’ earnings capacity has surprised positively so far and since late summer we are now in the next phase of the decline process which is about how much the earnings will fall before the market turns up again. Here, the differences between companies and sectors will be enormous and we will have to navigate the landscape before we are out on the other side. But this is a significantly better environment to work in as a stock picker, compared to large parts of last year (especially the first half of the year) where share prices fell across the board.
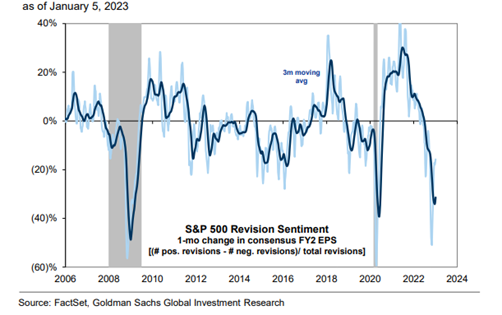
A graph from January 5 of this year shows the one-month trend of earnings per share for the S&P500 2024e. With a whopping 31% downward adjustment, it is the sharpest downward adjustment of the profit estimate since 2008 and 2020. The market has therefore in a short time begun to prepare for expected sharply declining profits.
The image below shows how the stock market has developed since 1948 in periods of time around a recession in the economy. The median decline from the highest level has been 24% and the rise thereafter 39%. The decline as it currently stands is 25%.

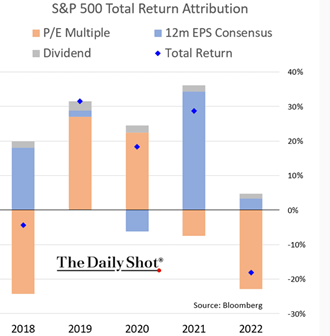
Below is an excellent illustration of what drives share prices in different years and in different conditions. 2020 clearly shows that it is possible to have a positive return one year despite the fact that companies generally have declining earnings. An even better example is 2009. Our assessment is that we will have a positive year in 2023, driven primarily by rising multiples despite declining earnings. That is, the reverse relationship compared to 2022.
 Source: The Daily Shot
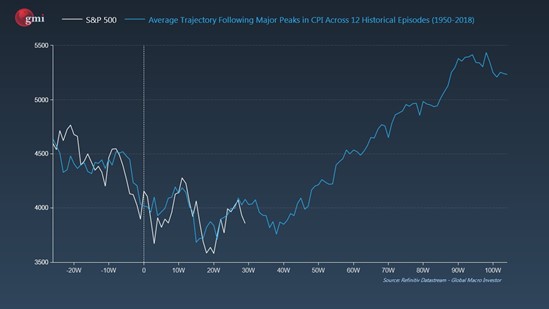
Historical data from 1950-2018, but zoomed in on a weekly basis, shows how the stock market in the US developed after inflation reached its highest level (0 on the x-axis). It doesn't necessarily have to be that way this time, but it is likely that inflation has already passed its highest level. Should history repeat itself, we have a 25% rise ahead of us in 2023.
 Source: Julien Bittel, gmi
The image below shows that when the US two-year interest rate has fallen below the policy rate, the stock market usually rises by an average of 15% after 6-9 months (purple line).
 Source: 3Fourteen Research
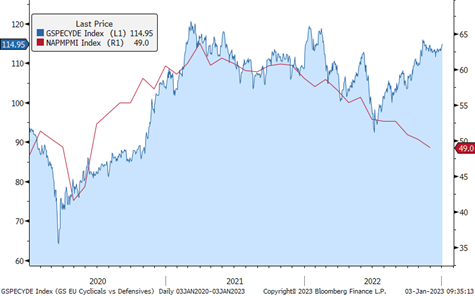
A good barometer of the stock market cycle is the difference in price development between defensive companies and cyclical companies. Cyclical companies have performed about 25% better than defensive companies since last summer, despite all economic doomsday prophecies.
 Source: Goldman Sachs
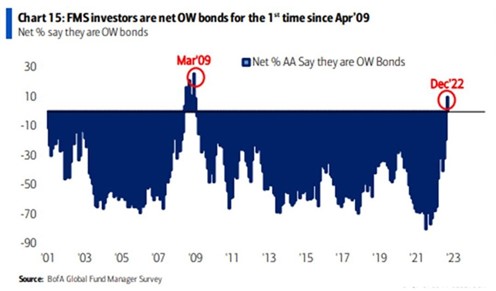
Investors are overweight bonds for the first time since March 2009 (!). The interest rate must go down!
The coming and announced recession among economists and strategists is the most anticipated we’ve experienced in almost 30 years. The cash balances of the world's investors have until the turn of the year been at record high levels, people are gloomy and short positions in many companies are at very high levels. The market view is that it will fall another 10 percent in the first half of the year, and then turn around.
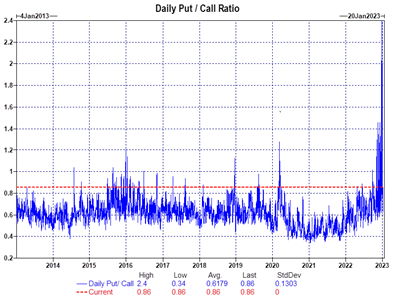
The exceptional image below shows the explosion in the purchase of put options over the past month. Not even during the financial crisis was the relationship between put options / call options as skewed as at the end of 2022. The investor collective was prepared for a sharp decline and instead 2023 has had the strongest start since 2009. This in turn creates stress for the investor collective who have a lot of cash and in many cases too defensive holdings and many have not even finished the Christmas break.
 Source: Goldman Sachs
We have a strong opinion that the conditions for European shares compared to American ones are better than they have been for a very long time. Below, a time series from 1988 that speaks its own language, showing that the valuation difference has never been greater. Add in a continued strong dollar that is expected to decline as interest rates move lower. At that point, the risk premium will probably also drop, which in that case gives a double effect.
 Source: Joakim Tabet Kepler Cheuvreux
It feels like it's time for a purple bar in the chart below. According to recent data from Goldman Sachs, there were outflows from US equity funds in the first week of 2023, which is unusual.
 Source: JPM
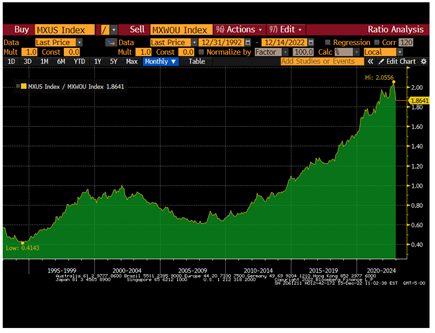
US stocks relative to global stocks since the early 1990s. Note the decline on the far right of the graph. Something happened at the end of 2022.
 Source: Bloomberg, Goldman Sachs
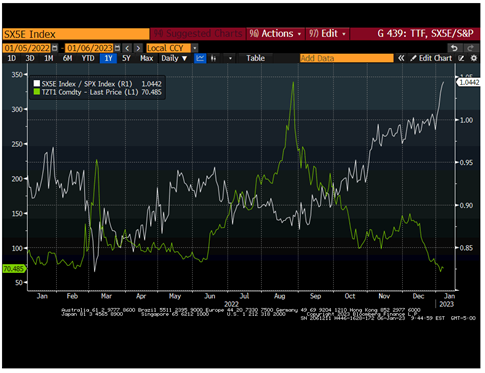
The white line below shows the relationship between the Eurostoxx and the S&P500. The green line is the price of gas. Since the start of October 2022, Eurostoxx has performed 15% better than the S&P500. At the same time, energy prices have fallen sharply.
 Source: Bloomberg, Goldman Sachs
It is easy to state that the point of maximum risk in the classic image below was in the fourth quarter of 2021. That changed literally overnight on January 2, 2022 when American long-term interest rates suddenly started to surge upwards. We note that this year, since a few days back, has started with a diametrically opposite trading pattern. Country after country is now showing signs of declining inflation, and China has made the biggest U-turn ever in their Covid policy, dramatically increasing the chances of an economic recovery.
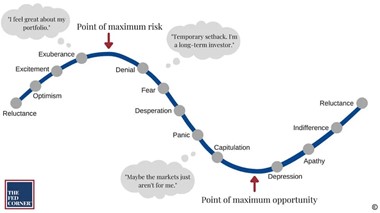
So where are we in the cycle? One data point is that the stock market generals of the last 10 years, US megatech companies, finally capitulated at the end of 2022. A blowout is almost always necessary to clear the air and begin a gradual recovery. Our best assessment (simplified) is that it is well illustrated in the picture above and we have since two months ago, as communicated in the last two monthly letters, a significantly more positive attitude towards the stock market.
Should we be right in the above, we have rolled into the point of maximum opportunity. Today's situation, with in many cases very low share prices and lethargic investors, is largely similar to the landscape as it looked in the spring of 2003 and the spring of 2009. An important difference then compared to now is that we do not have the central banks with us.
The last question then becomes how long does the point of maximum opportunity last? The ingredients and response to it is a cocktail consisting of inflation, central banks and geopolitical developments, but this phase in a cycle usually lasts 6-12 months and offers some turbulence at times.
The headwinds for an upswing continue to be that Europe is heading for recession and that central banks are raising interest rates too much. The tailwind is that country after country is now reporting falling inflation, expectations are low, investors are sitting with excess cash and stocks are underweight, and that the persistence of corporate profits has proven to be significantly more resilient. That you should take more risk now than you did in the last year appears to be highly reasonable.
In conclusion, I would like to extend a big thank you to Cecilia, Fredrik and Gustav who, despite headwinds during the year, have always remained focused on taking us forward and improving our business.
We wish all our readers Happy New Year and success in 2023!
Mikael & Team
Malmö on 10th of January2023
[/et_pb_text][et_pb_post_title _builder_version="3.0.89" title="on" meta="off" author="off" date="off" categories="off" comments="off" featured_image="off" featured_placement="below" text_color="dark" text_background="off" border_style="solid" module_class="gen-single-news-heading-module gen-trustee-single-headline" date_format="d M, Y" border_style_all="solid" disabled_on="on|on|on" disabled="on" /][et_pb_text admin_label="Coeli Nordic Corporate Bond Fund R-SEK" _builder_version="3.0.89" background_layout="light" module_class="gen-table-module" disabled_on="on|on|on" disabled="on"]
Coeli Nordic Corporate Bond Fund
| Performance in Share Class Currency | 1 Mth | YTD | 3 yrs | Since incep |
| Coeli Nordic Corporate Bond Fund - R SEK | 1.30% | -0.93% | 3.38% | 14.52% |
| | | | |
[/et_pb_text][et_pb_text admin_label="Coeli Nordic Corporate Bond Fund R-SEK" _builder_version="3.0.89" background_layout="light" module_class="gen-table-module" disabled_on="on|on|on" disabled="on"]
[cg_linear_graph id="31122"]
[/et_pb_text][et_pb_image _builder_version="3.0.89" src="https://coeli.com/wp-content/uploads//2020/10/ncbr.png" show_in_lightbox="off" url_new_window="off" use_overlay="off" always_center_on_mobile="on" force_fullwidth="off" show_bottom_space="on" disabled_on="on|on|on" disabled="on" /][et_pb_image _builder_version="3.0.89" src="https://coeli.com/wp-content/uploads/2019/01/Gustav-Fransson6.jpg" show_in_lightbox="off" url_new_window="off" use_overlay="off" always_center_on_mobile="on" force_fullwidth="off" show_bottom_space="on" custom_margin="||21px|" disabled_on="on|on|on" disabled="on" /][et_pb_text admin_label="Namn och title" _builder_version="3.0.89" background_layout="light" module_class="gen-single-ingress-module" custom_margin="||40px|" disabled_on="on|on|on" disabled="on"]
Gustav Fransson
Portfolio Manager of Coeli Nordic Corporate Bond Fund
[/et_pb_text][et_pb_image _builder_version="3.0.89" src="https://coeli.com/wp-content/uploads/2018/10/Alexander-Larsson-Vahlman.jpg" show_in_lightbox="off" url_new_window="off" use_overlay="off" always_center_on_mobile="on" force_fullwidth="off" show_bottom_space="on" custom_margin="||21px|" disabled_on="on|on|on" disabled="on" /][et_pb_text admin_label="Namn och title" _builder_version="3.0.89" background_layout="light" module_class="gen-single-ingress-module" custom_margin="||40px|" disabled_on="on|on|on" disabled="on"]
Alexander Wahlman
Senior Analyst
[/et_pb_text][et_pb_text admin_label="Top Holdings (%)" _builder_version="3.0.89" background_layout="light" custom_margin="||20px|" module_class="gen-trustee-single-table" disabled_on="on|on|on" disabled="on"]
Top Holdings (%)
| LANSBK 1.25% 18-17.09.25 | 4.1% |
| NORDEA HYP 1.0% 19-17.09.25 | 4.1% |
| SWEDBK 1.0% 19-18.06.25 | 4.1% |
| WHITE MOUNT FRN 17-22.09.47 | 3.9% |
| B2 HOLDING FRN 19-28.05.24 | 2.9% |
[/et_pb_text][/et_pb_column][/et_pb_row][et_pb_row _builder_version="3.0.89" background_position="top_left" background_repeat="repeat" background_size="initial" module_class="gen-single-news-content-row gen-trustee-single-content-row" custom_padding="0px|||" custom_padding_phone="23px|||" custom_padding_last_edited="on|tablet" module_class_2="gen-trustee-single-sidebar" disabled_on="on|on|on" disabled="on"][et_pb_column type="2_3"][et_pb_text admin_label="Tillbaka-knapp" _builder_version="3.0.89" background_layout="light" border_style="solid" custom_margin_tablet="||17px|" custom_margin_last_edited="on|desktop" module_class="gen-back-button hide-in-print" border_style_all="solid"]
Note that the information below describes the share class (I SEK), which is a share class reserved for institutional investors. Investments in other share classes generally have other conditions regarding, among other things, fees, which affects the share class' return. The information below regarding returns therefore differs from the returns in other share classes.
Return to Fund page
[/et_pb_text][et_pb_text admin_label="Datum / Skriv ut" _builder_version="3.0.89" background_layout="light" border_style="solid" custom_margin_tablet="||17px|" custom_margin_last_edited="on|desktop" module_class="gen-single-news-date-module gen-trustee-print-module hide-in-print" locked="on" border_style_all="solid"]
[blog_post_date]
Print
[/et_pb_text][et_pb_post_title _builder_version="3.0.89" title="on" meta="off" author="off" date="off" categories="off" comments="off" featured_image="off" featured_placement="below" text_color="dark" text_background="off" border_style="solid" module_class="gen-single-news-heading-module gen-trustee-single-headline" date_format="d M, Y" border_style_all="solid" /][et_pb_text _builder_version="3.0.89" background_layout="light"]
Utveckling september
Fondens värde sjönk -5,1 procent i september (andelsklass I SEK). Stoxx600 (brett Europaindex) sjönk under samma period med -3,4 procent och HedgeNordics NHX Equities var preliminärt oförändrat. Motsvarande siffror för 2021 är en ökning om +21,6 procent för fonden, +14,0 procent för Stoxx600 och +6,4 procent för NHX Equities.


Equity markets / Macro environment
After seven consecutive months of positive performance the world’s stock markets were poised for some degree of turbulence. Volatility was especially high in some equities and on Monday, September 20, the highest nominal volume ever traded was reached in options on the S&P500 (!) The broad European index fell by 3.4 percent in September compared to the S&P500 which fell by 4.8 percent. The fund also had its first negative performance since October last year with a decline of 5,1 percent. More about that later.
Despite high levels for many stock indices, sentiment among investors has been relatively gloomy. Bank of America's monthly survey recently showed that only 13 percent of managers expect a positive market in the future, which is the lowest figure since April 2020 (and that was clearly wrong). The reasons cited are China's growth problems, the crisis-stricken Chinese real estate giant Evergrande, the development of the delta variant, declining profit growth and, of course, rising inflation. However, they are still overweight equities which is perhaps not so strange when you have to pay to lend your capital to countries. As interest rates rose at the end of the month, the German 10-year interest rate followed with a giant step from - 0.25 percent to - 0.17 percent… The picture below is an overall risk indicator, and we are around zero (neutral).

The news flow in September began with record high inflation figures in Europe at +3.0 which exceeded market expectations. The corresponding figure in July was + 2.2 percent. It was the fastest growth rate since November 2011 and several countries recorded up to five percent in inflation rate. The pressure on the ECB to reduce its support measures is increasing. On Friday, October 1, new inflation figures came in for September, which showed a further acceleration in the inflation rate by +3.4 per cent.
The rate of change can be mostly attributed to rising energy prices that are starting to create real problems in the world's economies as well as agricultural shifts. The picture below shows that food prices are at record high levels over the past 60 years. The biggest losers are the poorest part of the population.

In the slightly longer term it is forecasted that it is not excessive demand that will drive inflation, but rather a limited supply, and then both in terms of products and labour. At the end of September, long queues were reported at petrol stations across the UK when fuel ran out and there were not enough truck drivers to refuel. Prime Minister Boris Johnson urges his citizens to refuel sensibly and at a normal rate. You wanted Brexit, so there you go. In sheer desperation, Johnson has now issued 5,000 temporary short-term visas for temporary drivers. Good luck.
M25 spring 2022?

Below are European gas prices which have risen in a seemingly uncontrolled fashion and recorded the highest September prices ever. A silent prayer for the mild winter. We guess that this development will soon be a major topic in the media, and it will undoubtedly create various problems and somewhat reduce next year's expected growth. It feels reassuring that Per Bolund (Swedish Green Party MP) claims that there is no electricity shortage in Sweden because then the costs for ordinary people would be unbearably high during the winter (which of course they will be). Rising gas and electricity prices have led European politicians to start discussing billion-dollar subsidies (in euros) to households and manufacturers who will experience sharply rising electricity bills over the winter.

Source: Bloomberg
Henrik Svensson, site manager at the oil-fired power plant in Karlshamn (south Sweden), does not agree with Per Bolund that we have a surplus of electricity in the country. For large parts of September, the power plant ran at full capacity and burned 240k liters of oil per hour. Henrik Svensson believes that it is electricity shortages and high electricity prices that are behind the high production. He also says that there is a lack of planned power production in southern Sweden and that it will take many years before the electricity grid is strengthened and new electricity production is in place. Sweden today burns more oil than we have done in 10 years. A gigantic energy policy and climate policy failure signed by the Green Party.

Source: Steget efter
Winning candidate for this year's Christmas presents below.

The change in the US 10-year interest rate created considerable pressure on, primarily, growth stocks at the end of the month. The performance dispersion for different sectors was very large in September with oil shares as a clear winner. This was also felt in the last days of September.

Source: Bloomberg
Below is the development for the US 10-year interest rate. The turbulence in the stock market was caused by the change in interest rate level breaking through on the upside, as can be seen in the chart.

There have been countless attempts to explain the turbulence in recent weeks. The recent and significant amount of options being exercised, Evergrande, interventions by the Chinese government, Fed tapering, Bank of England expected to raise interest rates, delta variant, inflation, bottlenecks in production, difficulties in finding staff, rising energy prices and declining growth rates. We think it is enough to look at the picture below. Rising interest rates hit hard at growth companies' valuations.

Goodbye Mutti and thank you for an extraordinary effort for Europe!

Source: Nyhetsbyrån TT
She was politically in a class of her own during the euro crisis ten years ago and Sweden also has her to thank for a lot. Despite a somewhat weaker performance in recent years, German citizens have experienced significantly better economic development than many others.

On September 29, the covid-19 restrictions in Sweden were finally removed and we can now, in principle, start living a normal life again. The number of bookings for winter holidays skyrocketed to the great joy of the tourist and transport industry. In recent months, tourism activity in the Mediterranean has been "extraordinary" and much better than forecasted before the summer. Luxury travel is also reaching new heights. Private jet passengers to Mallorca increased by +70 percent in July compared to July 2019 with an average of 83 private jets per day landing in Palma. If you want to rent a yacht, you are being referred to next year as basically everything has already been fully booked.
We now belong to a minority group. Passively managed capital exceeds actively managed capital for the first time ever. This will give us more opportunities as mispricing increases.

In addition to being one of the world's best stock markets this year, Sweden also has the most listed companies in the entire EU. Bloomberg drew attention to the fact that there are now around 1,000 listed companies on the various trading platforms in Stockholm. More than 80 percent are smaller companies, and the list is filled with new listings every day until Christmas! For us, it is interesting as we are constantly looking for new potential core holdings. In recent weeks, we have identified one which we write about under Long Positions.
We end this section with a picture that well reflects today's political level.

Source: Kluddniklas
Long positions
Truecaller
During September, we did a lot of work on the Swedish company Truecaller which will go public on October 8th. Truecaller is one of the most interesting companies we’ve seen in recent years. Truecaller has developed a phone application that can, among other things, identify unwanted calls from, for example, telemarketers. The app is one of the top ten most downloaded applications globally, and in some of the main markets such as India, Nigeria and Indonesia, it is one of the three most downloaded apps. As a Swedish company with headquarters in Stockholm, the firm has chosen to list on the Swedish stock exchange, which we are very happy about.
Truecaller was founded in 2009 by Alan Mamedi and Nami Zarringhalam. They met at the Royal Technical University in Stockholm, and they continue to be active in the company as the CEO and Chief Strategic Officer (CSO), respectively. When they released the first version of the app, they received 10,000 downloads within one week. By 2013 they had reached over 10 million users globally and in Q2 2021 they had reached 278 million monthly users. Throughout their journey, Truecaller has attracted several well-known investors such as Sequoia Capital (early investors in Apple, Whatsapp, and Zoom among others), Atomica (Skype-founder Niklas Zennström’s investment company), and Kleiner Perkins (early investors in Google, Amazon, and Spotify among others).

Until recently, revenue streams have mainly consisted of income from in-app advertising. In addition to this, there is a premium version where paying users can get additional functionalities. That business accounted for around 20 percent of revenues in 2020. During the fall of 2020, Truecaller launched a corresponding offering that targets corporates. This part of the business allows B2B customers to be listed as verified callers when they call private people. It can for example be a security company that calls about an alarm or a courier company that needs to get in contact with a receiving customer. It is a common problem that these types of companies get rejected when the call-receiver doesn’t recognize the number.
Truecaller declares that their product benefits from network effects. i.e., the product gets better the more people who use it (think Facebook). This can be relatively easy to appreciate since phone number identification inherently evolves from reporting of unwanted calls by the users, i.e., when enough people have reported an unwanted call Truecaller flags for this in the app). Over time, Truecaller has built a database containing 5.7 billion unique phone-identities. Network effects doesn’t just build a better product over time, they also increase the entry-barriers for potential competition.
The majority of Truecaller’s income comes from developing countries. The company explains that the problems related to spam emails, harassment, unwanted calls, and messages are more common there than in the western world. India is Truecaller’s largest market where these types of problems are significant. One positive aspect of the geographical exposure is that it allows for a nice structural tailwind: the population growth in developed markets is much higher than in the west (driven by an increasing average age) and the smartphone penetration is growing fast.
Historically, 97 percent of all app downloads have been organic. However, management has begun to experiment with user acquisitions by the way of advertisements through, for example, Facebook. The returns on user acquisition looks extremely attractive. In some markets, such as India, Truecaller could achieve a return on investment of up to 20x on every spent dollar. In more mature markets, such as the USA, the same multiple amounts to 4x, still very attractive. Indonesia, which is a relatively new market to the company, has a multiple of 0.8x. This means any user acquisition spend in Indonesia is unprofitable at this point. However, management is confident that the return profile will wander above the 1x as more users join and the network effects take place. In summary, the investment opportunities are plentiful and attractive – and unique.
In summary, several things speak for significant growth in the future. The investment in paid user acquisition, a sharpened premium-offer, the newly launched B2B product and continued growth of the advertising business. In addition to this, acquisitions may likely follow.
Growth has been prioritized over profitability and it is only recently that the company began to report profits. In 2019 sales grew by 57 percent. In 2020 the corresponding figure was 64 percent, and during the first half of 2021 the company’s sales grew with as much as 151 percent in comparison to the same period last year (which was partly affected by the pandemic). During the first half of this year, the company’s operating margin was 32 percent. As you can imagine, Truecaller is very capital-efficient. Working capital is very low which gives a nice cash conversion and a very high return on capital employed – all attributes that are required to create a very successful and valuable company over time.
Truecaller targets a revenue growth of at least 45 percent between 2021-2024e. After 2024 the EBITDA-margin should be at least 35 percent. The sum of the year-on-year growth and the EBITDA-margin should amount to at least 70 percent (a variant of the rule of 40 that tries to balance growth and profitability). We don’t think it will be difficult to reach these targets and the analyst estimates we have looked at are cautious, especially regarding profitability. In our preliminary prognosis for 2023, our EBITDA-estimate is around 16 percent ahead of the analyst estimates that we’ve studied. This is based on that Truecaller can continue to grow sales much faster than hiring new people while the gross margin improves slightly in coming years.
The gross margin is an interesting aspect of the equity story. Truecaller’s gross margin amounts to approximately 70 percent. Most of the cost of sales consists of platform fees to Apple and Google. Since Apple and Google practically control the distribution channels for apps together, a duopoly has occurred and prices for app-developers such as Truecaller have remained high around 25-30 percent of sales. This situation is now heavily criticized from all parts of the world since the situation is not considered competitive, for example
look at this analysis about an American court ruling concerning a twist between Epic Games and Apple. We believe Google and Apple’s fees will decrease over time – which would be a positive event for Truecaller. Furthermore, Truecaller’s new business deal bypasses Goggle and Apple, which gives a gross margin of close to 100 percent. This will strengthen the profitability even more.
There are of course risks associated with the dependence on Google/Apple (which is the case for every company in the application business); the geographical exposure and one should never write off the threat of competition even if it seems far away at this stage. However, we do believe the benefits outweighs the negatives. Truecaller has excellent financial characteristics, operational founders with large shareholdings who will remain active in the business and some of the world’s most well-known investors behind it. We therefore look forward to being included as an anchor investor ahead of the stock exchange listing on October 8th. We are even more excited to follow the company’s successes in current and new markets in the coming years.
CVS Group
One of the happiest days of the month was when our veterinarian company CVS Group released their interim numbers. Once again, the company beat analysts’ expectations which have been raised several times over the course of the year. In the first two months of the new financial year (which begins in July), the company has grown by 17 percent. This can be compared with the growth expectations for the full year which, before the report release, were 7 percent. Once again, analysts have thus far been “forced” to upgrade their assumptions. In a sour September stock market, the share fell 3 percent.
It becomes clear that the positive effect of the pandemic on pet ownership is more tenacious than ever. Pets live for many years, and we believe many underestimated the importance of the large number of new customers during the pandemic. Below is a graph of Google searches for veterinarians in the UK as well as data from the Swedish Board of Agriculture regarding the number of newly registered dogs. We speculate that the UK has similar trends as Sweden. The data points are also positive for our other pet company Swedencare. Pet companies are obviously still hot; right now there’s a bidding war going on over the German pet company Zooplus, where EQT is currently in the lead with the highest bid. We also note that there have been several venture capital-led acquisitions of veterinary companies at higher multiples than CVS is valued at.

Source: Jordbruksverket, Coeli

Source: Google Trends, Coeli
Lindab
Since our first investments in Lindab in the autumn of 2019, the thesis has always been that the building systems business segment did not fit into the business and in September, management finally found a buyer for the company. The transaction entails a write-down of goodwill corresponding to SEK 430 million, but it is cash flow neutral. Lindab took the opportunity to update its financial targets; the company now wants to grow by 10 percent per year (of which approximately two thirds are through acquisitions) and reach an operating margin of at least 10 percent (previously 10 percent over a business cycle). The share responded positively to the message.
We noted broad insider purchases in Lindab during the month, also from CEO Ola Ringdahl himself, which we think bodes well for the report in October. Despite this the share price decreased 8 percent in September.
Victoria
We have written several times about the British flooring company Victoria, which in September had a weak share price development of 17 percent. By all accounts, the company is doing well – during the month it was reported that sales rose 70 percent compared to 2020, and 50 percent compared to 2019. If you only partially extrapolate these figures for the rest of the year, it is obvious that analysts’ expectations are too low. We believe that this month’s decline is related to flows: growth companies and small and mid-cap companies were some of the most affected sectors in September – Victoria was hit from both sides. We have increased our position in recent days.
The Pebble Group
One of the month’s (few) joys was Pebble Group. As we previously wrote, the company is active in the market for gift advertising, i.e. gifts that companies give to customers, employees, and other stakeholders for marketing purposes. In September the company came out with its half-year figures that were better than expected. Pebble’s software division, Facilisgroup, is growing better than our expectations. This is also the part we believe the market is valuing too low. The stock rose 10 percent in September.
Knaus Tabbert
During the last trading day in September, our German motorhome manufacturer Knaus Tabbert announced that the forecasts for 2021 must be lowered due to component shortages. We are not particularly surprised that this has happened given what we have seen from other vehicle manufacturers. If the company can remedy these supplier problems, management believes that 2022 will be unaffected at best, as Knaus still has a bursting order book, increased production capacity and more suppliers from January next year. The share fell 7 percent in September.
Short positions
The short portfolio contributed with a negative result during the month. Our short-term negative positions in the German DAX had the largest negative contribution. Some stock specific short positions that contributed positively to the result were Swedish Dometic, German Henkel and Norwegian NEL.
Exposure
The net exposure, adjusted for our unlisted holdings, at the beginning and end of the month was 76 and 74 percent, respectively.
Summary
September's negative return of x percent also meant the end of the fund's, so far, longest period of positive return (10 months). We are obviously disappointed with that, but we have been in the game long enough to understand that equities sometimes must fall to be able to refuel and continue their upward trajectory. In general, September was the weakest month for many equities since the crisis started 1.5 years ago. September, otherwise, started strong for us and was a continuation of an unusually good performance at the end of August. Our companies presented many good news (except for Knaus Tabbert on the last day of the month) but small-caps and especially those categorized as growth shares, had a very weak performance during September. The main reason for this was, as previously mentioned, the change in the US long-term interest rate and general "risk off".
The picture below shows the development since March last year compared with the corresponding time intervals in the financial crisis in 2009 and onwards. Both periods have shown an unusually strong recovery and the current trend is even stronger than when the financial crisis raged 12 years ago.

Source: Goldman Sachs
Since the crisis started 1.5 years ago, we have had three different phases. The first and shortest, "despair", showed a decline in prices of 33 percent. The second phase, "hope", ended at the beginning of this year and showed a very strong return of 79 percent despite declining earnings. The last, “growth”, where we are now, has shown +11 percent in share prices with sharply rising growth for companies' earnings, but at lower valuations.

Source: Goldman Sachs
The recovery for American companies (below) has been extremely strong and compared to 2019, the 2021 profits will be approximately 36 percent higher. Very impressive.

Source: Goldman Sachs
It is very gratifying that Europe, for once, is keeping up with the United States and showing strong profit growth. Compare this with the non-existent profit growth between 2007–2019 (!)

Despite rising equity prices, valuations have fallen and Europe is now trading around 16x the profit 12 months ahead. It's not very strenuous (we think). For an average commercial property, you can get a return of maybe 3 percent before net financial costs. After financing, this corresponds to at least P/E 50x. And paying to lend to different countries does not feel like an exciting alternative either.

Source: Goldman Sachs
The valuation of global shares in relation to global GDP looks more strained. A major reason for this is the central banks' aggressive policy.

The valuation of the major leading technology companies is at an average level seen from the last five years.

Source: Goldman Sachs
The image below is striking. It shows that Swedish property prices, which have risen by almost 200 percent over the past 15 years, have had the same development as the money supply. In theory, price per m2 and krona is unchanged for the past 15 years. Is there anyone who still doubts that the world's central banks are responsible for the largest wealth creation in human history? It is important to be on the wagon because when it is gone you’ve missed it. And what central banks cannot push, the price of bitcoin for example, rises even more as central banks cannot make more of it. The opportunities for central banks to reverse the band are few. In the long run, this means that the next 10 years will, overall, be a good period for, for example, stock picking. All forms of uniqueness (growth) will be highly valued to compensate for the fact that the value of money decreases at a rapid pace.

If there is anyone who is still not convinced, take a look at the picture below. The market capitalization of the S&P500 divided by the Fed's balance sheet….

Source: Bloomberg
Onwards and upwards. The wealth of American households is accelerating away from the change in GDP.

Thank you Fed and all the world central banks!

Citigroup's surprise index has weighed down and analysts' profit estimates are also starting to soften. Not a good combination and it has undoubtedly contributed to the weak development in the stock markets recently.

It took a full 219 days for the S&P500 to have a decline of 5 percent. We will see how high the next bar will be.

Timing is everything. A fascinating graph that shows the importance of having reasonable timing in decisions.

Source: Goldman Sachs
Despite a difficult month behind us, it feels reasonable to expect a stronger market during the last quarter of the year. Our view is that we are still in a rising market, although we are likely to experience some turbulence for a few more weeks. "Bear markets" are constantly declining with sharp rallies while "bull markets" continue to rise with some strong drawdowns. We therefore believe that we are still in a rising market.
Some statistics to cheer you up. The S&P500 managed to rise by 0.2 percent in the third quarter (Europe -1.9 percent) which means six consecutive positive quarters. This has only happened eight times before and only on one of the (eight) occasions has the following quarter yielded a negative return. Two quarters later, it has in all cases yielded a positive return. In addition, for the past 20 years, October has been the fourth best month, thus much better than its reputation. Having pointed that out, October takes first place in terms of most frequent daily movements that exceed one percent.
The Stockholm Stock Exchange, which is an excellent reference point, had risen by 30 percent at its highest about a month ago, but is currently at 20 percent. Even more important is that measured in USD, OMX has "only" risen by 13 percent, which is in line with the US stock markets. This is hardly excessive given the profit growth among the companies. The risk premium in the market is high.
Investors are reasonably careless, and we are approaching the turn of the year. Global growth is well above average and interest rates are extremely low. Given how cruel the market has been to many investors this year, with sector rotations and a high concentration of companies driving performance, it almost feels obvious that the broad mass of investors will continue to reduce risk in their portfolios and then be short equities at year-end when the market rises. We'll see, but that's our main scenario right now.

We are now closing the books for the third quarter, and we look forward to the end of the year and above all the entrance for Truecaller on the Stockholm Stock Exchange on October 8!
Thank you for this month and we'll hear from you later.
Mikael & Team
Malmö on 5 October
[/et_pb_text][et_pb_text admin_label="Coeli Nordic Corporate Bond Fund R-SEK" _builder_version="3.0.89" background_layout="light" module_class="gen-table-module" disabled_on="on|on|on" disabled="on"]
Coeli Nordic Corporate Bond Fund
| Performance in Share Class Currency | 1 Mth | YTD | 3 yrs | Since incep |
| Coeli Nordic Corporate Bond Fund - R SEK | 1.30% | -0.93% | 3.38% | 14.52% |
| | | | |
[/et_pb_text][et_pb_text admin_label="Coeli Nordic Corporate Bond Fund R-SEK" _builder_version="3.0.89" background_layout="light" module_class="gen-table-module" disabled_on="on|on|on" disabled="on"]
[cg_linear_graph id="31122"]
[/et_pb_text][et_pb_image _builder_version="3.0.89" src="https://coeli.com/wp-content/uploads//2020/10/ncbr.png" show_in_lightbox="off" url_new_window="off" use_overlay="off" always_center_on_mobile="on" force_fullwidth="off" show_bottom_space="on" disabled_on="on|on|on" disabled="on" /][/et_pb_column][et_pb_column type="1_3"][et_pb_image _builder_version="3.0.89" src="https://coeli.com/wp-content/uploads/2019/01/Gustav-Fransson6.jpg" show_in_lightbox="off" url_new_window="off" use_overlay="off" always_center_on_mobile="on" force_fullwidth="off" show_bottom_space="on" custom_margin="||21px|" disabled_on="on|on|on" disabled="on" /][et_pb_text admin_label="Namn och title" _builder_version="3.0.89" background_layout="light" module_class="gen-single-ingress-module" custom_margin="||40px|" disabled_on="on|on|on" disabled="on"]
Gustav Fransson
Portfolio Manager of Coeli Nordic Corporate Bond Fund
[/et_pb_text][et_pb_image _builder_version="3.0.89" src="https://coeli.com/wp-content/uploads/2018/10/Alexander-Larsson-Vahlman.jpg" show_in_lightbox="off" url_new_window="off" use_overlay="off" always_center_on_mobile="on" force_fullwidth="off" show_bottom_space="on" custom_margin="||21px|" disabled_on="on|on|on" disabled="on" /][et_pb_text admin_label="Namn och title" _builder_version="3.0.89" background_layout="light" module_class="gen-single-ingress-module" custom_margin="||40px|" disabled_on="on|on|on" disabled="on"]
Alexander Wahlman
Senior Analyst
[/et_pb_text][et_pb_text admin_label="Fund Overview" _builder_version="3.0.89" background_layout="light" custom_margin="||20px|" module_class="gen-trustee-single-table"]
Fund Overview
| Inception Date | 2017-12-20 |
| Investment management fee (share class I SEK) | 1.00% p.a + 20% Performance fee (OMRX T-Bill Index) |
| Performance Fee. Yes | 20% |
| Risk category | 5 of 7 |
[/et_pb_text][et_pb_text admin_label="Top Holdings (%)" _builder_version="3.0.89" background_layout="light" custom_margin="||20px|" module_class="gen-trustee-single-table" disabled_on="on|on|on" disabled="on"]
Top Holdings (%)
| LANSBK 1.25% 18-17.09.25 | 4.1% |
| NORDEA HYP 1.0% 19-17.09.25 | 4.1% |
| SWEDBK 1.0% 19-18.06.25 | 4.1% |
| WHITE MOUNT FRN 17-22.09.47 | 3.9% |
| B2 HOLDING FRN 19-28.05.24 | 2.9% |
[/et_pb_text][/et_pb_column][/et_pb_row][/et_pb_section][et_pb_section bb_built="1" fullwidth="off" specialty="off" _builder_version="3.0.89" module_class="gen-trustee-single-yield-section gen-pattern-section" custom_padding="0px|||"][et_pb_row _builder_version="3.0.89" custom_padding="||53px|"][et_pb_column type="4_4"][et_pb_text admin_label="VIKTIG INFORMATION" _builder_version="3.0.89" background_layout="light" module_class="gen-trustee-single-warning-blurb"]
IMPORTANT INFORMATION. This is a marketing communication.
Before making any final investment decisions, please refer to the prospectus of Coeli SICAV II, its Annual Report, and the KID of the relevant Sub-Fund. Relevant information documents are available in English at coeli.com. A summary of investor rights will be available at
https://coeli.com/regulatory-information-coeli-asset-management-ab/.
Past performance is not a guarantee of future returns. The price of the investment may go up or down and an investor may not get back the amount originally invested.
[/et_pb_text][/et_pb_column][/et_pb_row][/et_pb_section]