[et_pb_section bb_built="1" fullwidth="off" specialty="off" _builder_version="3.0.89" background_image="https://coeli.com/wp-content/uploads//2018/08/malmo-bro-comp.jpg" parallax="on" module_class="gen-trustee-single-hero"][et_pb_row][et_pb_column type="4_4"][/et_pb_column][/et_pb_row][/et_pb_section][et_pb_section bb_built="1" fullwidth="off" specialty="off" _builder_version="3.0.89" custom_padding="0px||0px|"][et_pb_row][et_pb_column type="4_4"][/et_pb_column][/et_pb_row][et_pb_row _builder_version="3.0.89" background_position="top_left" background_repeat="repeat" background_size="initial" custom_padding="0px|||" custom_padding_phone="23px|||" custom_padding_last_edited="on|tablet" module_class_2="gen-trustee-single-sidebar" module_class="gen-single-news-content-row "][et_pb_column type="4_4"][et_pb_text admin_label="Tillbaka-knapp" _builder_version="3.0.89" background_layout="light" border_style="solid" custom_margin_tablet="||17px|" custom_margin_last_edited="on|desktop" module_class="gen-back-button hide-in-print"]
Note that the information below describes the share class (I SEK), which is a share class reserved for institutional investors. Investments in other share classes generally have other conditions regarding, among other things, fees, which affects the share class' return. The information below regarding returns therefore differs from the returns in other share classes.
Before making any final investment decisions, please read the prospectus, its Annual Report, and the KID of the relevant Sub-Fund here
[/et_pb_text][et_pb_text admin_label="Tillbaka-knapp" _builder_version="3.0.89" background_layout="light" border_style="solid" custom_margin_tablet="||17px|" custom_margin_last_edited="on|desktop" module_class="gen-back-button hide-in-print" border_style_all="solid"]
This material is marketing communication
[/et_pb_text][et_pb_text admin_label="Datum / Skriv ut" _builder_version="3.0.89" background_layout="light" border_style="solid" custom_margin_tablet="||17px|" custom_margin_last_edited="on|desktop" module_class="gen-single-news-date-module gen-trustee-print-module hide-in-print" locked="on" border_style_all="solid"]
[blog_post_date]
Print
[/et_pb_text][et_pb_text _builder_version="3.0.89" background_layout="light"]
Monthly Newsletter Coeli Absolute European Equity – February 2023
FEBRUARY PERFORMANCE
The fund’s value increased by 1.6% in February (share class I SEK). The Stoxx600 (broad European index) increased during the same period by 1.7% and HedgeNordic’s NHX Equities increased provisionally by 0.1%. The corresponding figures for 2023 are an increase of 6.9% for the fund, 8.5% for the Stoxx600 and 2.6% for NHX Equities.


EQUITY MARKETS / MACRO ENVIRONMENT
The strong start to the year on the world's equity markets continued into February. A surprisingly strong US economy combined with an inflation rate, which in several countries declined slower than expected, contributed to the risk premium rising and share prices retreating in the second half. Before the last days of the month, the Dow Jones index had fallen for four straight weeks. The S&P500 and Nasdaq showed the same pattern, albeit with a somewhat stronger development. Overall, the S&P500 was down 2.6% in local currency. Europe continued to develop significantly stronger than the US and the broad European index SXXP600 rose by 1.7%. Admittedly measured in local currency, but it is very unusual for such large differences in broad major stock indices. The fund returned +1.6% in February and it was across the board a very good reporting season for the fund, with the exception of Norwegian Photocure which came in with a surprisingly weak report. More on this in the Long Positions section.
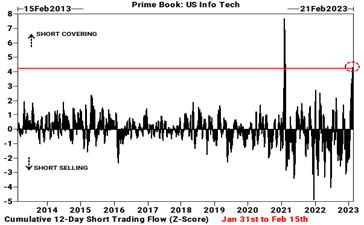
Significant contributing factors to the strong development at the beginning of February was the huge amount of short covering and in particular among US technology stocks. According to Goldman Sachs, there has only been one occasion in the last 10 years where there have been larger volumes than during these days in February. Volumes were in the 99.5th percentile!
 Source: Goldman Sachs
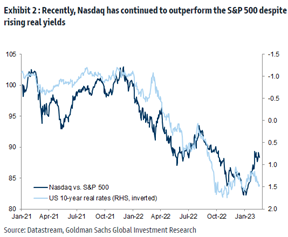
Despite rising interest rates, the Nasdaq has had a stronger development than the S&P500 recently. The correlation below has been at least temporarily broken. They will meet again, and the question is whether it is the interest rate or the Nasdaq that drops back first.
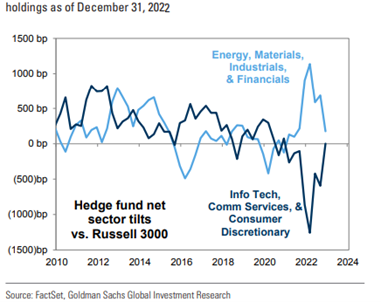
The chart below shows hedge funds' increasing exposure to technology and consumer stocks in recent months at the expense of oil/mining companies, industrials and banking stocks. Last year's winners have clearly been replaced by last year's losers.
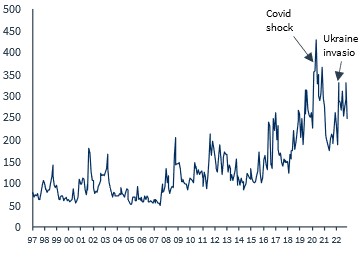
The global economic policy uncertainty index unfortunately shows with undoubted clarity that we are still at historically high levels of uncertainty with all that that entails.
 Source: Kepler Cheuvreux
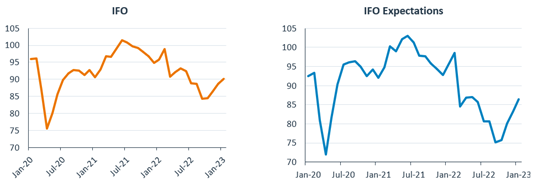
On a more positive note is the rising confidence of the German business community (left image) and perhaps even more gratifying, the companies' expectations going forward (right). A clear improvement is visible, even if we are still at low levels.
 Source: Kepler Cheuvreux
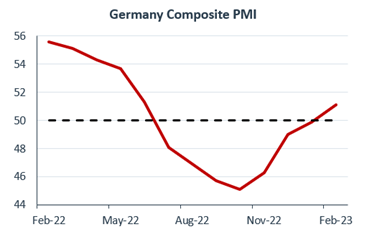
Even the purchasing managers in Germany show some resumed growth in busing activity.
 Source: Kepler Cheuvreux
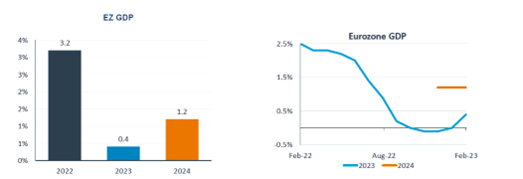
Economic growth in the eurozone is expected to accelerate after the summer.
 Source: Kepler Cheuvreux, Consensus Economics
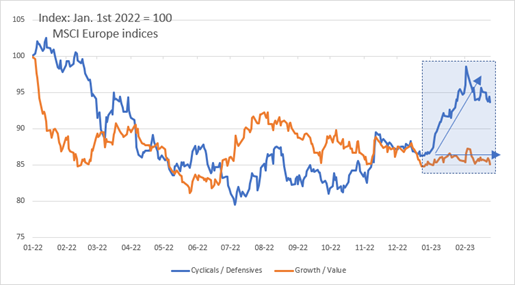
The expected economic growth has contributed to cyclical companies in relation to defensive companies (blue line) having a significantly better return during the beginning of 2023. Growth companies in relation to value companies have, after a tough 2022, had a similar development during the first two months of the year.
 Source: Kepler Cheuvreux
The big gossip of the month was, as so many times before, the rising interest rate. Expectations at which level the Fed will end interest rate hikes have been gradually rising for a long time. In February, expectations took a substantial step upwards from 4.6% to 5.4%. A very strong increase. We note that the European and American stock markets in this climate had significantly different returns with the US as a clear loser. For example, the French CAC rose by 2.6% while the S&P500 fell by 2.6% in February.

Swedish interest rates also rose significantly during the month. A year ago, the Swedish two-year-old was negative, but since then the picture has changed radically. Note the rise in recent weeks. From 2.35% to 3.25% in three weeks!
 Source: Bloomberg
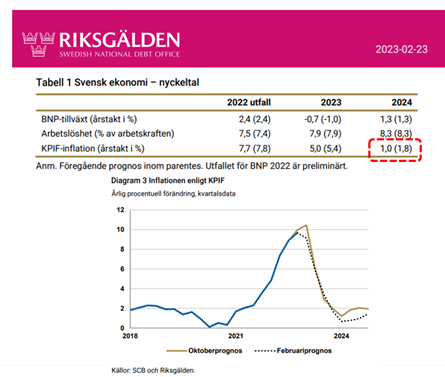
The National Debt Office presented new forecasts at the end of the month in which they halved their inflation forecast for 2024 to only 1%. Even before Christmas this year, they expect inflation to fall below the target of 2%. We hope they are right. That inflation will drop significantly from here is fairly certain, but the speed is unclear. Regardless, it bodes well for hard-pressed Swedish borrowers.
In Germany, people are not as optimistic about the inflation trend. However, it is not newsworthy and a troubled past on the subject is likely playing a role in that.
 Source: Bloomberg, Holger Zschaepitz
European gas prices have collapsed and are now at the same level as in the fall of 2021. This is probably the single strongest contributor of the European economy unexpectedly outperforming in recent months. In the long run, this is likely the reason why European stock markets had large inflows at the expense of above all American ones.
 Source: Bloomberg
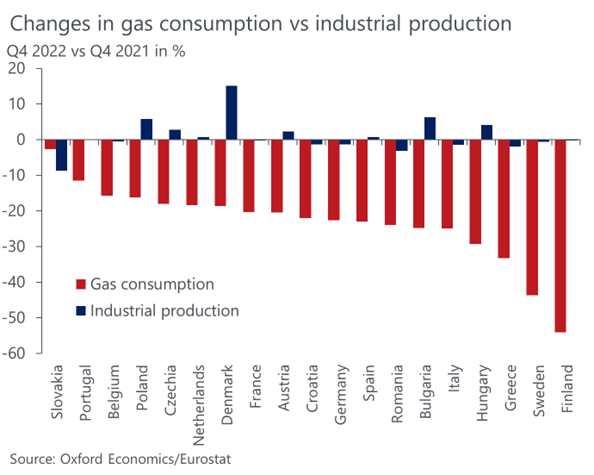
Picture of the month! Despite 20-30% less gas consumption in Europe, industrial production is basically unchanged. Every cloud has a silver lining. The European companies show great flexibility and an impressive resistance to rising costs. The obedient may wonder how much coal consumption has increased? We don't have the answer, but it has certainly increased.
Sweden is gaining international attention in terms of the sharply falling prices for villas and apartments. Sweden together with Norway, Canada, Australia and New Zealand now form the abbreviation CANNS with particularly high vulnerability in private indebtedness. There's even an ASR Canns House Price Index to follow for those interested. Kick the can down the road - economies.
“There is no sign of aliens or extraterrestrial activity in connection with the recent shootings. Wanted to make sure the American people understood that”. The reassuring words were conveyed by the White House press secretary after the United States shot down some balloons at the beginning of the month. How lucky! One was a Chinese spy balloon and another three were balloons of unknown private origin. US Secretary of State, Antony Blinken, had to cancel his trip to China at short notice.
 Source: Fox News, Twitter
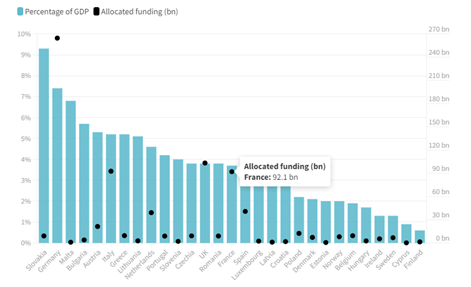
So, the long-awaited electricity support finally begins to reach hard-tested electricity customers. The image below shows how much different European countries support consumers in relation to their respective GDP, as well as in absolute numbers in billions of euros. Most EU countries have removed or greatly reduced VAT. Sweden makes it easy and keeps 25% VAT, it gets so complicated otherwise. The energy tax has also been greatly reduced in many countries. In the country “Differently”, Sweden, as the only country in the EU, raised the energy tax at the turn of the year from 45 to 49 öre per kWh because of rising inflation. Fair is fair.
 Source: Bruegel
The UK surprised the financial market positively in February with a strong recovery in consumer confidence. Optimism is still well below historical averages, but the strong rebound surprised many and the pound strengthened against both the dollar and the euro.
UK Prime Minister, Rishi Sunak, and European Commission President, Ursula von der Leyen, met at the end of the month to discuss and try to resolve the tainted Northern Ireland issue. "A new chapter between the EU and Great Britain has now begun," Sunak said at the press conference held at Windsor Castle outside London. The tone was more cordial than it has been for years and let's hope he also succeeds in the next step in the process which is to get unionists and Tory politicians to accept the deal. "Hard core" Brexiters are still probably more interested in buying an old colony or similar from the British Empire and dreaming of bygone times.
About as unusual as the northern lights in southern Sweden (which we got to experience at the end of February), is that the Swedish krona strengthens against the euro. When the new Governor of the Riksbank (Swedish Central Bank), Erik Thedéen, during his first press conference on the 9th of February, said some warm words about the Swedish krona, it had an immediate effect and the krona's strengthening against the euro during the month ended at +2.7%. It wasn't a year too early and the fact that the previous management until recently scattered kronor to spread the risks (!) despite a record low level for the Swedish krona appears completely inconceivable. It is the same board that bought most of what was available in Swedish housing bonds in an overheated housing market well into 2022. This contributed to an unrealized loss of 81 billion for the Riksbank in 2022 and the state will probably have to contribute with capital. Erik Thedéen will not come to a set table, and we wish him the best of luck with his mission, which now thankfully also seems to include strengthening the Swedish krona. The image below shows EUR/SEK since autumn 2021 and the circle on the right in the diagram shows the time of Thedéen's first press conference - a clear strengthening of SEK.
 Source: BloombergLong positionsTate & Lyle
We introduced British food company Tate & Lyle to our readers in our
February 2022 monthly newsletter, which is exactly one year ago. Our investment thesis at the time was basically based on the fact that the company's value would become evident after the sale of roughly 50% of one of their business divisions ("Primary Products") which had volatile earnings with dull growth prospects. The remaining business clearly has much sophisticated financial characteristics and with a clear exposure to ingredients for sugar reduction, which is a fast-growing market.
If we look at the share's performance since a year ago, we were right: The share held up very well during a difficult stock market last year and has risen by around 13% this year. Operationally, the company has delivered on its projections. At the same time, we have seen how the company's valuation multiple has risen somewhat.
February was a joyful month for those of us who like the company, when a capital market day was held for the first time in five years. Among other things, we were offered updated financial targets, which included annual sales growth at group level of 4-6% combined with a profit that should rise by around 7-9% per year. This implied an upgrade against the analysts' estimate. In addition to the financial aspects, a deep dive into more qualitative matters such as product portfolio and research/development was offered.
With our estimates, Tate & Lyle now trades at EV/EBIT 12x for the financial year 2025e, which ends in March. We think the share deserves further appreciation, and with a target multiple of EV/EBIT 15x, we reach an upside of 20% in just over a year's time. If you want to dream, you can look at other ingredient companies that enjoy significantly more generous valuation multiples and think about where Tate & Lyle might be valued in a few years, given a longer history then with the new company structure. The share price increased almost 7% during the month.
ISS
One of our larger holdings, ISS, has risen 4% so far in 2023, compared to the European index (SXXP600) of 9%. The corresponding figures for 2022 are 18% and -13%, respectively. After a strong year in 2022, the ISS share has thus begun 2023 hesitantly. It's not surprising given how the market has been so far in 2023. The tune has been to sell last year's winners in favor of last year's losers. If we look at similar shares, such as French Sodexo or British Compass Group, ISS has the best performance this year.
Focusing on the important aspects: After a positive sales update for the full year 2022 in January, we got our hands on the company's annual report in February. An important update was the company's guidance for 2023. The expectation is now that ISS will be able to grow organically by 4-6% this year, to be compared to the analysts' expectation of 4%. We note that ISS managed to raise its renewal rate (the percentage of existing customers who do not leave ISS) to a whopping 94%, higher than 92% and 91% in 2021 and 2020, and also in the years before that.
The stock is still trading at multiples that are lower than history, while the company's talented management has delivered on everything that has been communicated so far. We are still satisfied owners and think that the share should initially be traded above 200 Danish kroner, which is an upside of around 30% from today's levels. We have taken advantage of ISS stock's relative weakness this year to increase our position at prices around 145.
Pets at Home
The fund's strongest contributor in 2023 continued to go deliver in February with no particular news to justify it. On the contrary, a couple of brokerage houses have actually chosen to take profit by closing their buy recommendations. We think it is premature, even though we also sold some shares as the price had risen 36% at of the end of February this year.
Wincanton
Despite a perfectly acceptable earnings update in January, Wincanton has had a gutsy 2023 so far. We believe it is due to the fact that there was a large individual seller in the stock. The fund bought shares in a larger transaction that we believe was the seller's last shares. The stock rose 5% in February and the rise in price came after the seller appeared to have finished. It is often the flows of buying and selling that determine the price in the short term in illiquid shares.
Lindab
Lindab also released its Q4 report in February. The company's operating profit of SEK 244 million was around 11% below the preliminary estimates. It emerged later during the report presentation on the same day that the operating profit had been charged with 25 million kroner of costs that many other companies would have treated as one-offs, but Lindab; however, did not do in this case (exemplary!). It is therefore not possible to call the report a disappointment.
On the contrary, we note that Lindab's large inventory, which was greatly inflated by higher raw material prices, finally fell from Q3 to Q4. For a few quarters, Lindab's margin has been squeezed by buying material at high prices to ensure delivery security. Sometime during Q2 2023, the negative effect should be phased out. In his CEO speech, Ola Ringdahl was determined that the company will reach its goal of at least a 10% margin in 2023, which the analysts still do not seem to believe if we look at the consensus estimate. If he is right and the sales estimates hold, then positive estimate revisions could be in the cards for 2023. We increased our position in February and the stock is up 14% so far this year.
Photocure
The big disappointment of the reporting period came from Photocure. The company's sales figures came in a bit below analysts' expectations. At the same time, the company's guidance for 2023 was below market expectations, but expected growth of 20% and profitability at EBITDA level before "one-off costs" (which we interpreted as relating to acquisition costs et al.). In short, the report was not good and therefore the stock fell 24% in February. As such, Photocure was also the fund's largest negative contributor.
BoneSupport
BoneSupport delivered another record quarter coming in 6% above consensus. Adjusted for a few non-recurring items, the operating profit was reasonably in line with expectations. The company is growing sales by 49% organically on an annual basis. Cerament G was launched in the US during the quarter and got off to a good start in the first two months. Sales are focused on the large university hospitals and their "key opinion leaders" to increase speed and penetration in the sales process. It is a long process to become the standard treatment in a large hospital and we expect slightly bumpy but continued rising sales of Cerament G in the coming quarters. According to the company, the company has received very positive feedback from surgeons, and we feel confident that the company will deliver over time. It was also pleasing that the standard product (Cerament BVF) continues to grow sequentially, which indicates that there is still a lot for BoneSupport to do in the US. The company's unique product and position, its strong momentum and an attractive valuation if our long-term estimates are reasonably correct, mean that BoneSupport continues to be one of the fund's largest positions.
SLP
Our logistics property company SLP also reported during February. It was a strong end to the year where we saw positive changes in the value of properties despite the yield requirement being raised by 20 basis points. This is the core of the investment case where new lettings, acquisitions and CPI adjustment of 2023 rents drive NAV growth. SLP's balance sheet is strong and the company is ready to capitalize on a messy real estate market where several players have gone from net buyers to net sellers in the past year. We continue to like SLP and would rather own high-yielding logistics properties that are largely 100% inflation-indexed than many other property-related properties that have lower yields.
Corem
The real estate company Corem also reported during February. Operationally, the report was somewhat better than expected. The weakness was a NAV development that was below our expectations, driven by higher yield requirements (20 basis points higher) and write-downs in the associated company Corem Kelly. Having said that, we do not own Corem primarily because of the NAV development in the first place, but a strong operating net in combination with a sky-high risk premium. The financing cost in the quarter was also slightly higher.
In recent months, the company has sold properties which, together with its holdings in Castellum, are expected to bring in a total of over 7 billion. The biggest deal was with Blackstone, where cash is to be exchanged at the beginning of April. So far, all properties have been sold around book value, which is in stark contrast to the discount to NAV, which is still around 65%. That the share is not traded at a higher level despite these sales may seem a little strange to us, and we have therefore continued to increase our holding. We also note that Corem, after the Blackstone deal, owns logistics properties for 11-12 billion. These properties are traded at a 65%discount in relation to the net asset value, while logistics properties in Sweden and Europe are traded at a premium of 20-30%. Here, it should be possible to create shareholder value with some kind of structural transaction, we think.
The market's perception of Corem is almost exclusively how to deal with its bond maturities and general financing. Our view is that after the Blackstone deal, the company largely control their own destiny and have several options, including buying back the bonds in their entirety.
An investment in Corem has a higher risk than, for example, SLP or our previous holding in Wihlborgs, but the potential is also significantly greater in the short and medium term. With inflation expected to drop significantly for the rest of the year, that should lead to pressure on interest rates after the summer, which in turn should increase interest in a stock like Corem. The stock fell by 5% in February and has fallen and risen by 8% this year
Saint Gobain
The fund invested in Saint Gobain in December when we scanned for low-valued cyclical companies with an attractive risk/reward. At the time of our initial investment, the company was valued at a very low 7x 2023e net earnings. The return on equity was 12-13% and all this with low debt. It was clear that the market did not believe that the transformation the company has made since 2018 will significantly improve earnings quality going forward. At meetings with the company, there was a certain frustration about this.
This year will be an important test for the company. So far, the market has been far too skeptical, which has benefited us. At the end of the month, an excellent quarterly report was published that beat low expectations, and in addition, a relatively optimistic forecast for the full year was communicated, which led to consensus expectations being subsequently raised by 3-5%. The stock has risen by 23% this year, of which 7% came in February.
Commerzbank
For the third month in a row, we have reason to mention Commerzbank. Although the fund has only been an owner since mid-November, the share has nearly risen by 50% since then. The reasons why the stock continued to rise by 11% in February, after rising by 10% in December and 18% in January, are several: 1) Continued rising interest rates that are burning the net interest income 2) Commerzbank was included in the important index DAX30 3) A very strong quarterly report that led to analysts on average adjusting earnings estimates by 10-15%.
The image below shows that in December the share traded below 8 euros per share compared to today's 11.60 and that the profit per share in a few months has been adjusted up by as much as 25% for the current year.
 Source: BloombergShort positions
The short portfolio contributed with a minor negative result for the month. The largest positive contribution came from our short futures position on the OMX Stockholm index and the biggest negative contribution was our short position in a Swedish small company index.
Exposure
The net exposure, adjusted for our unlisted holdings, at the beginning and end of the month was 72% and 77% respectively.
Summary
Since the lows at the end of September last year, the DAX has risen by 27% compared to the S&P500's more modest 2%, measured in euros. That's a huge difference in just five months and is mainly due to:
• The big American tech companies have had problems with growth and thus their valuation
• The difference in valuation between Europe and the US was initially record-breaking
• Europe as an asset class was considered a pariah for most of last year due to war and energy supply
• Europe experienced a mild winter and thus significantly less energy problems
• The European economy has been much more resilient than predicted
• China has opened up the country, which benefits Europe more than the US (greater exposure)
 Source: Bloomberg
The European stock market is currently trading around 12-13x forward-looking 12-month P/E. The recent rise in the stock market can barely be glimpsed in the image below, which shows 36 years of valuation history.
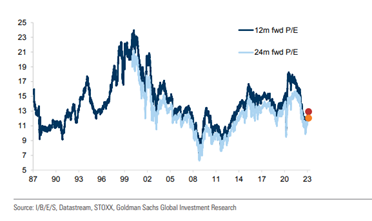
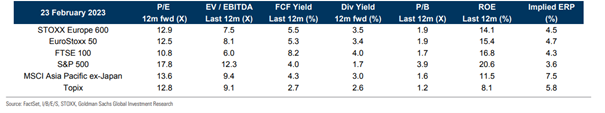
Despite a strong development last year, the UK is still the lowest valued stock market, while the US is the highest. Also note the difference in return on equity. The USA is in a class of its own and thus deserves a higher valuation.
In addition to the above explanations for why Europe has been much stronger than the US, it may also be that the terminal rate in the US is a bigger problem than the terminal rate in the Eurozone. At the time of writing, the expected terminal interest rate is 5.4% in the US compared to Europe's 3.9%. The American economy continues to be under pressure with unemployment that is non-existent. In Europe and not least in Sweden, we now have a growth rate that implies an ongoing recession and thus it may be that the interest rate is less of a threat to the stock market in Europe than in the USA. Below US unemployment for the last 50-60 years. We are witnessing historic lows.
 Source: Bloomberg
The rising interest rate in the US does not seem to be fully reflected in the stock market. This could mean that the US stock market is facing a serious headwind. Another scenario is that inflation suddenly drops and pulls down interest rates. Or the historically high correlation between the interest rate and the P/E ratio will not return, but that does not seem likely. At least the current valuation of the S&P500 does not leave much room for multiple expansion, but the development is more dependent on earnings growth. Europe is in a completely different situation.
 Source: True Insights, fred.stlouisfed.org, Bloomberg
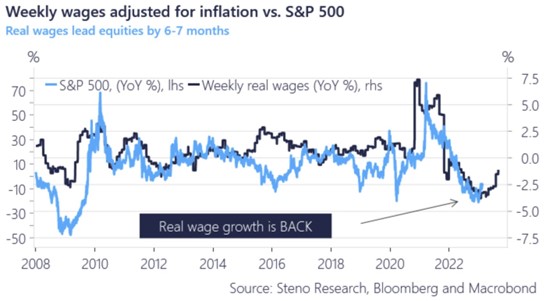
A large part of US GDP is private consumption. We note that hard-pressed US consumers are finally experiencing positive real wage gains. Developments in real wages have historically, with a 6–9 month lag, been a strong leading indicator for developments on the stock market. However, it does nothing to tame inflation. In Europe, real wages are expected to rise after the summer. The trade sector is this year the third best sector in the broad European index, so investors have paid attention to this.
20 years of loan growth in Sweden now down in negative territory. A fascinating picture of a head-on collision in the Swedish consumer sector. It is not really this dramatic in the rest of Europe.
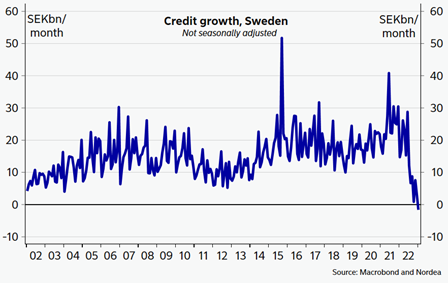 Source: Macrobond, Nordea
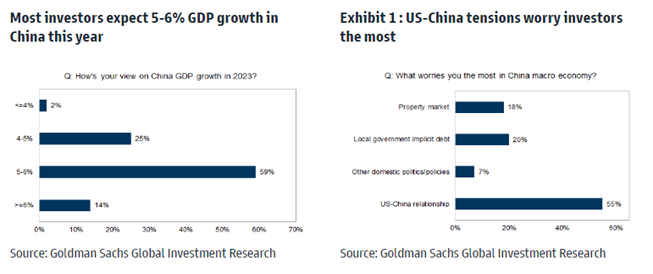
When it comes to fighting inflation, China is currently the big winner as they have no inflation to speak of. In contrast to the rest of the world, they have not had the same expansive economic policy as in the West, but they took the hits right then and there. The last few years, on the other hand, have been the most difficult ever. However, expectations for a quick start are high with expected growth of 5-6% this year. At time of writing in the morning of March 1
st China released their PMI data which showed the highest activity since April 2012! The Asian stock markets reacted positively with Hong Kong at +4.2%.
Liquidity in the Chinese economy has increased substantially and is of course orchestrated by the Chinese state. It would be surprising if this does not lead to increased global economic activity within a few quarters.
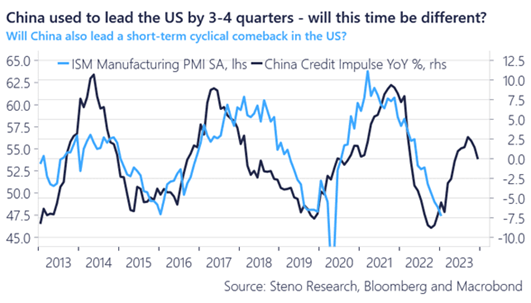
The bottleneck problems continue to decrease in the economy, which is a major contributor to global economic development, while the inflationary pressure on the margin decreases.
 Source: Kepler Cheuvreux
The global purchasing index has historically been an excellent indicator for predicting the share price performance of cyclical companies relative to more defensive companies. What is a little strange is that the optimism below is not reflected among the large investor collective. It appears that the shares were bought under duress.
 Source: Kepler Cheuvreux
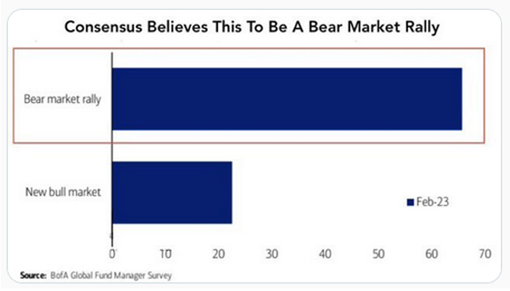
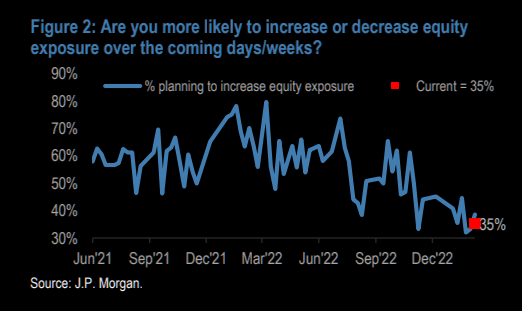
An overwhelming majority still believes that we are in a bear market rally and that share prices will therefore drop significantly. Some days bad news is good news and vice versa depending on the mood. Right now, the recession in the US is being pushed forward all the time and that is considered a problem. Many challenges remain, but the positive is that the bottleneck problems are significantly reduced, China is picking up speed, the oil price is stable and inflation, despite several setbacks recently, is likely to continue to fall. And perhaps most important of all, the companies as a collective have so far mastered the challenges well or very well.
Another picture on the same theme. Pessimism continues to dominate.
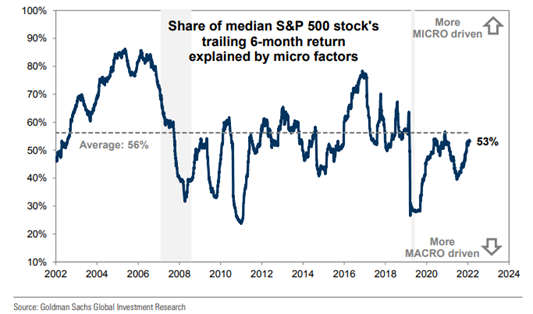
As we wrote about in the annual letter, our view this year is that it will be a significantly better "stock picking" year. The image below shows that company-specific news increases in importance when it comes to driving the share price. It benefits our business and thus also the return on our investments.
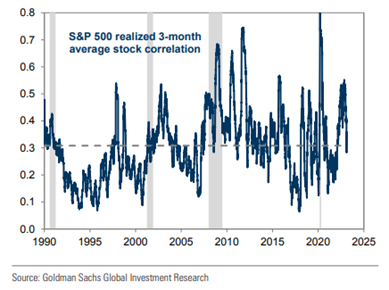
The covariation between different stocks is also falling, which is positive. In the Covid crash three years ago, the correlation was 0.8, i.e., it mattered little how the company delivered. Almost all shares were traded down outright.
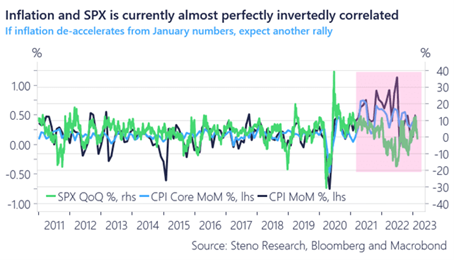
The biggest reason for the general pessimism among investors is inflation. The bow is tight and when the data starts to surprise positively, which we actually think is possible, there will most likely be a big buying pressure. We saw that, for example, on November 10th last year when the Nasdaq rose by 7.5% in one day. The image below shows the inverse correlation between the S&P500 and inflation.
In conclusion, we maintain our positive fundamental view even though we see a number of significant challenges. We do not have a strong idea of whether we will go up or down in the short term, however, our belief is that we are at a higher level than today when the year is over.
Those interested in history and statistics may note that when the return on the S&P500 after 25 days of the year has risen more than 5%, the median return for the rest of the year has ended at 17.6%. As many as 16 out of 17 times this has been true, with 1987 being the only exception.
We continue working on our company analyses, which is the most important thing for our result. It is therefore gratifying to state that, with only one exception, our reporting season was very good, which means that the company analyses were accurate.
Finally, we are very pleased to share with our readers that Norges Bank Investment Management appointed us as one of their external managers during 2022. The mandate encompasses an active long only European equity portfolio, and we are humble and very proud to have received such as prestigious instruction.
Enjoy the spring which is around the corner!
Mikael & Team
Malmö on 3nd of March 2023
[/et_pb_text][et_pb_post_title _builder_version="3.0.89" title="on" meta="off" author="off" date="off" categories="off" comments="off" featured_image="off" featured_placement="below" text_color="dark" text_background="off" border_style="solid" module_class="gen-single-news-heading-module gen-trustee-single-headline" date_format="d M, Y" border_style_all="solid" disabled_on="on|on|on" disabled="on" /][et_pb_text admin_label="Coeli Nordic Corporate Bond Fund R-SEK" _builder_version="3.0.89" background_layout="light" module_class="gen-table-module" disabled_on="on|on|on" disabled="on"]
Coeli Nordic Corporate Bond Fund
| Performance in Share Class Currency | 1 Mth | YTD | 3 yrs | Since incep |
| Coeli Nordic Corporate Bond Fund - R SEK | 1.30% | -0.93% | 3.38% | 14.52% |
| | | | |
[/et_pb_text][et_pb_text admin_label="Coeli Nordic Corporate Bond Fund R-SEK" _builder_version="3.0.89" background_layout="light" module_class="gen-table-module" disabled_on="on|on|on" disabled="on"]
[cg_linear_graph id="31122"]
[/et_pb_text][et_pb_image _builder_version="3.0.89" src="https://coeli.com/wp-content/uploads//2020/10/ncbr.png" show_in_lightbox="off" url_new_window="off" use_overlay="off" always_center_on_mobile="on" force_fullwidth="off" show_bottom_space="on" disabled_on="on|on|on" disabled="on" /][et_pb_image _builder_version="3.0.89" src="https://coeli.com/wp-content/uploads/2019/01/Gustav-Fransson6.jpg" show_in_lightbox="off" url_new_window="off" use_overlay="off" always_center_on_mobile="on" force_fullwidth="off" show_bottom_space="on" custom_margin="||21px|" disabled_on="on|on|on" disabled="on" /][et_pb_text admin_label="Namn och title" _builder_version="3.0.89" background_layout="light" module_class="gen-single-ingress-module" custom_margin="||40px|" disabled_on="on|on|on" disabled="on"]
Gustav Fransson
Portfolio Manager of Coeli Nordic Corporate Bond Fund
[/et_pb_text][et_pb_image _builder_version="3.0.89" src="https://coeli.com/wp-content/uploads/2018/10/Alexander-Larsson-Vahlman.jpg" show_in_lightbox="off" url_new_window="off" use_overlay="off" always_center_on_mobile="on" force_fullwidth="off" show_bottom_space="on" custom_margin="||21px|" disabled_on="on|on|on" disabled="on" /][et_pb_text admin_label="Namn och title" _builder_version="3.0.89" background_layout="light" module_class="gen-single-ingress-module" custom_margin="||40px|" disabled_on="on|on|on" disabled="on"]
Alexander Wahlman
Senior Analyst
[/et_pb_text][et_pb_text admin_label="Top Holdings (%)" _builder_version="3.0.89" background_layout="light" custom_margin="||20px|" module_class="gen-trustee-single-table" disabled_on="on|on|on" disabled="on"]
Top Holdings (%)
| LANSBK 1.25% 18-17.09.25 | 4.1% |
| NORDEA HYP 1.0% 19-17.09.25 | 4.1% |
| SWEDBK 1.0% 19-18.06.25 | 4.1% |
| WHITE MOUNT FRN 17-22.09.47 | 3.9% |
| B2 HOLDING FRN 19-28.05.24 | 2.9% |
[/et_pb_text][/et_pb_column][/et_pb_row][et_pb_row _builder_version="3.0.89" background_position="top_left" background_repeat="repeat" background_size="initial" module_class="gen-single-news-content-row gen-trustee-single-content-row" custom_padding="0px|||" custom_padding_phone="23px|||" custom_padding_last_edited="on|tablet" module_class_2="gen-trustee-single-sidebar" disabled_on="on|on|on" disabled="on"][et_pb_column type="2_3"][et_pb_text admin_label="Tillbaka-knapp" _builder_version="3.0.89" background_layout="light" border_style="solid" custom_margin_tablet="||17px|" custom_margin_last_edited="on|desktop" module_class="gen-back-button hide-in-print" border_style_all="solid"]
Note that the information below describes the share class (I SEK), which is a share class reserved for institutional investors. Investments in other share classes generally have other conditions regarding, among other things, fees, which affects the share class' return. The information below regarding returns therefore differs from the returns in other share classes.
Return to Fund page
[/et_pb_text][et_pb_text admin_label="Datum / Skriv ut" _builder_version="3.0.89" background_layout="light" border_style="solid" custom_margin_tablet="||17px|" custom_margin_last_edited="on|desktop" module_class="gen-single-news-date-module gen-trustee-print-module hide-in-print" locked="on" border_style_all="solid"]
[blog_post_date]
Print
[/et_pb_text][et_pb_post_title _builder_version="3.0.89" title="on" meta="off" author="off" date="off" categories="off" comments="off" featured_image="off" featured_placement="below" text_color="dark" text_background="off" border_style="solid" module_class="gen-single-news-heading-module gen-trustee-single-headline" date_format="d M, Y" border_style_all="solid" /][et_pb_text _builder_version="3.0.89" background_layout="light"]
Utveckling september
Fondens värde sjönk -5,1 procent i september (andelsklass I SEK). Stoxx600 (brett Europaindex) sjönk under samma period med -3,4 procent och HedgeNordics NHX Equities var preliminärt oförändrat. Motsvarande siffror för 2021 är en ökning om +21,6 procent för fonden, +14,0 procent för Stoxx600 och +6,4 procent för NHX Equities.


Equity markets / Macro environment
After seven consecutive months of positive performance the world’s stock markets were poised for some degree of turbulence. Volatility was especially high in some equities and on Monday, September 20, the highest nominal volume ever traded was reached in options on the S&P500 (!) The broad European index fell by 3.4 percent in September compared to the S&P500 which fell by 4.8 percent. The fund also had its first negative performance since October last year with a decline of 5,1 percent. More about that later.
Despite high levels for many stock indices, sentiment among investors has been relatively gloomy. Bank of America's monthly survey recently showed that only 13 percent of managers expect a positive market in the future, which is the lowest figure since April 2020 (and that was clearly wrong). The reasons cited are China's growth problems, the crisis-stricken Chinese real estate giant Evergrande, the development of the delta variant, declining profit growth and, of course, rising inflation. However, they are still overweight equities which is perhaps not so strange when you have to pay to lend your capital to countries. As interest rates rose at the end of the month, the German 10-year interest rate followed with a giant step from - 0.25 percent to - 0.17 percent… The picture below is an overall risk indicator, and we are around zero (neutral).

The news flow in September began with record high inflation figures in Europe at +3.0 which exceeded market expectations. The corresponding figure in July was + 2.2 percent. It was the fastest growth rate since November 2011 and several countries recorded up to five percent in inflation rate. The pressure on the ECB to reduce its support measures is increasing. On Friday, October 1, new inflation figures came in for September, which showed a further acceleration in the inflation rate by +3.4 per cent.
The rate of change can be mostly attributed to rising energy prices that are starting to create real problems in the world's economies as well as agricultural shifts. The picture below shows that food prices are at record high levels over the past 60 years. The biggest losers are the poorest part of the population.

In the slightly longer term it is forecasted that it is not excessive demand that will drive inflation, but rather a limited supply, and then both in terms of products and labour. At the end of September, long queues were reported at petrol stations across the UK when fuel ran out and there were not enough truck drivers to refuel. Prime Minister Boris Johnson urges his citizens to refuel sensibly and at a normal rate. You wanted Brexit, so there you go. In sheer desperation, Johnson has now issued 5,000 temporary short-term visas for temporary drivers. Good luck.
M25 spring 2022?

Below are European gas prices which have risen in a seemingly uncontrolled fashion and recorded the highest September prices ever. A silent prayer for the mild winter. We guess that this development will soon be a major topic in the media, and it will undoubtedly create various problems and somewhat reduce next year's expected growth. It feels reassuring that Per Bolund (Swedish Green Party MP) claims that there is no electricity shortage in Sweden because then the costs for ordinary people would be unbearably high during the winter (which of course they will be). Rising gas and electricity prices have led European politicians to start discussing billion-dollar subsidies (in euros) to households and manufacturers who will experience sharply rising electricity bills over the winter.

Source: Bloomberg
Henrik Svensson, site manager at the oil-fired power plant in Karlshamn (south Sweden), does not agree with Per Bolund that we have a surplus of electricity in the country. For large parts of September, the power plant ran at full capacity and burned 240k liters of oil per hour. Henrik Svensson believes that it is electricity shortages and high electricity prices that are behind the high production. He also says that there is a lack of planned power production in southern Sweden and that it will take many years before the electricity grid is strengthened and new electricity production is in place. Sweden today burns more oil than we have done in 10 years. A gigantic energy policy and climate policy failure signed by the Green Party.

Source: Steget efter
Winning candidate for this year's Christmas presents below.

The change in the US 10-year interest rate created considerable pressure on, primarily, growth stocks at the end of the month. The performance dispersion for different sectors was very large in September with oil shares as a clear winner. This was also felt in the last days of September.

Source: Bloomberg
Below is the development for the US 10-year interest rate. The turbulence in the stock market was caused by the change in interest rate level breaking through on the upside, as can be seen in the chart.

There have been countless attempts to explain the turbulence in recent weeks. The recent and significant amount of options being exercised, Evergrande, interventions by the Chinese government, Fed tapering, Bank of England expected to raise interest rates, delta variant, inflation, bottlenecks in production, difficulties in finding staff, rising energy prices and declining growth rates. We think it is enough to look at the picture below. Rising interest rates hit hard at growth companies' valuations.

Goodbye Mutti and thank you for an extraordinary effort for Europe!

Source: Nyhetsbyrån TT
She was politically in a class of her own during the euro crisis ten years ago and Sweden also has her to thank for a lot. Despite a somewhat weaker performance in recent years, German citizens have experienced significantly better economic development than many others.

On September 29, the covid-19 restrictions in Sweden were finally removed and we can now, in principle, start living a normal life again. The number of bookings for winter holidays skyrocketed to the great joy of the tourist and transport industry. In recent months, tourism activity in the Mediterranean has been "extraordinary" and much better than forecasted before the summer. Luxury travel is also reaching new heights. Private jet passengers to Mallorca increased by +70 percent in July compared to July 2019 with an average of 83 private jets per day landing in Palma. If you want to rent a yacht, you are being referred to next year as basically everything has already been fully booked.
We now belong to a minority group. Passively managed capital exceeds actively managed capital for the first time ever. This will give us more opportunities as mispricing increases.

In addition to being one of the world's best stock markets this year, Sweden also has the most listed companies in the entire EU. Bloomberg drew attention to the fact that there are now around 1,000 listed companies on the various trading platforms in Stockholm. More than 80 percent are smaller companies, and the list is filled with new listings every day until Christmas! For us, it is interesting as we are constantly looking for new potential core holdings. In recent weeks, we have identified one which we write about under Long Positions.
We end this section with a picture that well reflects today's political level.

Source: Kluddniklas
Long positions
Truecaller
During September, we did a lot of work on the Swedish company Truecaller which will go public on October 8th. Truecaller is one of the most interesting companies we’ve seen in recent years. Truecaller has developed a phone application that can, among other things, identify unwanted calls from, for example, telemarketers. The app is one of the top ten most downloaded applications globally, and in some of the main markets such as India, Nigeria and Indonesia, it is one of the three most downloaded apps. As a Swedish company with headquarters in Stockholm, the firm has chosen to list on the Swedish stock exchange, which we are very happy about.
Truecaller was founded in 2009 by Alan Mamedi and Nami Zarringhalam. They met at the Royal Technical University in Stockholm, and they continue to be active in the company as the CEO and Chief Strategic Officer (CSO), respectively. When they released the first version of the app, they received 10,000 downloads within one week. By 2013 they had reached over 10 million users globally and in Q2 2021 they had reached 278 million monthly users. Throughout their journey, Truecaller has attracted several well-known investors such as Sequoia Capital (early investors in Apple, Whatsapp, and Zoom among others), Atomica (Skype-founder Niklas Zennström’s investment company), and Kleiner Perkins (early investors in Google, Amazon, and Spotify among others).

Until recently, revenue streams have mainly consisted of income from in-app advertising. In addition to this, there is a premium version where paying users can get additional functionalities. That business accounted for around 20 percent of revenues in 2020. During the fall of 2020, Truecaller launched a corresponding offering that targets corporates. This part of the business allows B2B customers to be listed as verified callers when they call private people. It can for example be a security company that calls about an alarm or a courier company that needs to get in contact with a receiving customer. It is a common problem that these types of companies get rejected when the call-receiver doesn’t recognize the number.
Truecaller declares that their product benefits from network effects. i.e., the product gets better the more people who use it (think Facebook). This can be relatively easy to appreciate since phone number identification inherently evolves from reporting of unwanted calls by the users, i.e., when enough people have reported an unwanted call Truecaller flags for this in the app). Over time, Truecaller has built a database containing 5.7 billion unique phone-identities. Network effects doesn’t just build a better product over time, they also increase the entry-barriers for potential competition.
The majority of Truecaller’s income comes from developing countries. The company explains that the problems related to spam emails, harassment, unwanted calls, and messages are more common there than in the western world. India is Truecaller’s largest market where these types of problems are significant. One positive aspect of the geographical exposure is that it allows for a nice structural tailwind: the population growth in developed markets is much higher than in the west (driven by an increasing average age) and the smartphone penetration is growing fast.
Historically, 97 percent of all app downloads have been organic. However, management has begun to experiment with user acquisitions by the way of advertisements through, for example, Facebook. The returns on user acquisition looks extremely attractive. In some markets, such as India, Truecaller could achieve a return on investment of up to 20x on every spent dollar. In more mature markets, such as the USA, the same multiple amounts to 4x, still very attractive. Indonesia, which is a relatively new market to the company, has a multiple of 0.8x. This means any user acquisition spend in Indonesia is unprofitable at this point. However, management is confident that the return profile will wander above the 1x as more users join and the network effects take place. In summary, the investment opportunities are plentiful and attractive – and unique.
In summary, several things speak for significant growth in the future. The investment in paid user acquisition, a sharpened premium-offer, the newly launched B2B product and continued growth of the advertising business. In addition to this, acquisitions may likely follow.
Growth has been prioritized over profitability and it is only recently that the company began to report profits. In 2019 sales grew by 57 percent. In 2020 the corresponding figure was 64 percent, and during the first half of 2021 the company’s sales grew with as much as 151 percent in comparison to the same period last year (which was partly affected by the pandemic). During the first half of this year, the company’s operating margin was 32 percent. As you can imagine, Truecaller is very capital-efficient. Working capital is very low which gives a nice cash conversion and a very high return on capital employed – all attributes that are required to create a very successful and valuable company over time.
Truecaller targets a revenue growth of at least 45 percent between 2021-2024e. After 2024 the EBITDA-margin should be at least 35 percent. The sum of the year-on-year growth and the EBITDA-margin should amount to at least 70 percent (a variant of the rule of 40 that tries to balance growth and profitability). We don’t think it will be difficult to reach these targets and the analyst estimates we have looked at are cautious, especially regarding profitability. In our preliminary prognosis for 2023, our EBITDA-estimate is around 16 percent ahead of the analyst estimates that we’ve studied. This is based on that Truecaller can continue to grow sales much faster than hiring new people while the gross margin improves slightly in coming years.
The gross margin is an interesting aspect of the equity story. Truecaller’s gross margin amounts to approximately 70 percent. Most of the cost of sales consists of platform fees to Apple and Google. Since Apple and Google practically control the distribution channels for apps together, a duopoly has occurred and prices for app-developers such as Truecaller have remained high around 25-30 percent of sales. This situation is now heavily criticized from all parts of the world since the situation is not considered competitive, for example
look at this analysis about an American court ruling concerning a twist between Epic Games and Apple. We believe Google and Apple’s fees will decrease over time – which would be a positive event for Truecaller. Furthermore, Truecaller’s new business deal bypasses Goggle and Apple, which gives a gross margin of close to 100 percent. This will strengthen the profitability even more.
There are of course risks associated with the dependence on Google/Apple (which is the case for every company in the application business); the geographical exposure and one should never write off the threat of competition even if it seems far away at this stage. However, we do believe the benefits outweighs the negatives. Truecaller has excellent financial characteristics, operational founders with large shareholdings who will remain active in the business and some of the world’s most well-known investors behind it. We therefore look forward to being included as an anchor investor ahead of the stock exchange listing on October 8th. We are even more excited to follow the company’s successes in current and new markets in the coming years.
CVS Group
One of the happiest days of the month was when our veterinarian company CVS Group released their interim numbers. Once again, the company beat analysts’ expectations which have been raised several times over the course of the year. In the first two months of the new financial year (which begins in July), the company has grown by 17 percent. This can be compared with the growth expectations for the full year which, before the report release, were 7 percent. Once again, analysts have thus far been “forced” to upgrade their assumptions. In a sour September stock market, the share fell 3 percent.
It becomes clear that the positive effect of the pandemic on pet ownership is more tenacious than ever. Pets live for many years, and we believe many underestimated the importance of the large number of new customers during the pandemic. Below is a graph of Google searches for veterinarians in the UK as well as data from the Swedish Board of Agriculture regarding the number of newly registered dogs. We speculate that the UK has similar trends as Sweden. The data points are also positive for our other pet company Swedencare. Pet companies are obviously still hot; right now there’s a bidding war going on over the German pet company Zooplus, where EQT is currently in the lead with the highest bid. We also note that there have been several venture capital-led acquisitions of veterinary companies at higher multiples than CVS is valued at.

Source: Jordbruksverket, Coeli

Source: Google Trends, Coeli
Lindab
Since our first investments in Lindab in the autumn of 2019, the thesis has always been that the building systems business segment did not fit into the business and in September, management finally found a buyer for the company. The transaction entails a write-down of goodwill corresponding to SEK 430 million, but it is cash flow neutral. Lindab took the opportunity to update its financial targets; the company now wants to grow by 10 percent per year (of which approximately two thirds are through acquisitions) and reach an operating margin of at least 10 percent (previously 10 percent over a business cycle). The share responded positively to the message.
We noted broad insider purchases in Lindab during the month, also from CEO Ola Ringdahl himself, which we think bodes well for the report in October. Despite this the share price decreased 8 percent in September.
Victoria
We have written several times about the British flooring company Victoria, which in September had a weak share price development of 17 percent. By all accounts, the company is doing well – during the month it was reported that sales rose 70 percent compared to 2020, and 50 percent compared to 2019. If you only partially extrapolate these figures for the rest of the year, it is obvious that analysts’ expectations are too low. We believe that this month’s decline is related to flows: growth companies and small and mid-cap companies were some of the most affected sectors in September – Victoria was hit from both sides. We have increased our position in recent days.
The Pebble Group
One of the month’s (few) joys was Pebble Group. As we previously wrote, the company is active in the market for gift advertising, i.e. gifts that companies give to customers, employees, and other stakeholders for marketing purposes. In September the company came out with its half-year figures that were better than expected. Pebble’s software division, Facilisgroup, is growing better than our expectations. This is also the part we believe the market is valuing too low. The stock rose 10 percent in September.
Knaus Tabbert
During the last trading day in September, our German motorhome manufacturer Knaus Tabbert announced that the forecasts for 2021 must be lowered due to component shortages. We are not particularly surprised that this has happened given what we have seen from other vehicle manufacturers. If the company can remedy these supplier problems, management believes that 2022 will be unaffected at best, as Knaus still has a bursting order book, increased production capacity and more suppliers from January next year. The share fell 7 percent in September.
Short positions
The short portfolio contributed with a negative result during the month. Our short-term negative positions in the German DAX had the largest negative contribution. Some stock specific short positions that contributed positively to the result were Swedish Dometic, German Henkel and Norwegian NEL.
Exposure
The net exposure, adjusted for our unlisted holdings, at the beginning and end of the month was 76 and 74 percent, respectively.
Summary
September's negative return of x percent also meant the end of the fund's, so far, longest period of positive return (10 months). We are obviously disappointed with that, but we have been in the game long enough to understand that equities sometimes must fall to be able to refuel and continue their upward trajectory. In general, September was the weakest month for many equities since the crisis started 1.5 years ago. September, otherwise, started strong for us and was a continuation of an unusually good performance at the end of August. Our companies presented many good news (except for Knaus Tabbert on the last day of the month) but small-caps and especially those categorized as growth shares, had a very weak performance during September. The main reason for this was, as previously mentioned, the change in the US long-term interest rate and general "risk off".
The picture below shows the development since March last year compared with the corresponding time intervals in the financial crisis in 2009 and onwards. Both periods have shown an unusually strong recovery and the current trend is even stronger than when the financial crisis raged 12 years ago.

Source: Goldman Sachs
Since the crisis started 1.5 years ago, we have had three different phases. The first and shortest, "despair", showed a decline in prices of 33 percent. The second phase, "hope", ended at the beginning of this year and showed a very strong return of 79 percent despite declining earnings. The last, “growth”, where we are now, has shown +11 percent in share prices with sharply rising growth for companies' earnings, but at lower valuations.

Source: Goldman Sachs
The recovery for American companies (below) has been extremely strong and compared to 2019, the 2021 profits will be approximately 36 percent higher. Very impressive.

Source: Goldman Sachs
It is very gratifying that Europe, for once, is keeping up with the United States and showing strong profit growth. Compare this with the non-existent profit growth between 2007–2019 (!)

Despite rising equity prices, valuations have fallen and Europe is now trading around 16x the profit 12 months ahead. It's not very strenuous (we think). For an average commercial property, you can get a return of maybe 3 percent before net financial costs. After financing, this corresponds to at least P/E 50x. And paying to lend to different countries does not feel like an exciting alternative either.

Source: Goldman Sachs
The valuation of global shares in relation to global GDP looks more strained. A major reason for this is the central banks' aggressive policy.

The valuation of the major leading technology companies is at an average level seen from the last five years.

Source: Goldman Sachs
The image below is striking. It shows that Swedish property prices, which have risen by almost 200 percent over the past 15 years, have had the same development as the money supply. In theory, price per m2 and krona is unchanged for the past 15 years. Is there anyone who still doubts that the world's central banks are responsible for the largest wealth creation in human history? It is important to be on the wagon because when it is gone you’ve missed it. And what central banks cannot push, the price of bitcoin for example, rises even more as central banks cannot make more of it. The opportunities for central banks to reverse the band are few. In the long run, this means that the next 10 years will, overall, be a good period for, for example, stock picking. All forms of uniqueness (growth) will be highly valued to compensate for the fact that the value of money decreases at a rapid pace.

If there is anyone who is still not convinced, take a look at the picture below. The market capitalization of the S&P500 divided by the Fed's balance sheet….

Source: Bloomberg
Onwards and upwards. The wealth of American households is accelerating away from the change in GDP.

Thank you Fed and all the world central banks!

Citigroup's surprise index has weighed down and analysts' profit estimates are also starting to soften. Not a good combination and it has undoubtedly contributed to the weak development in the stock markets recently.

It took a full 219 days for the S&P500 to have a decline of 5 percent. We will see how high the next bar will be.

Timing is everything. A fascinating graph that shows the importance of having reasonable timing in decisions.

Source: Goldman Sachs
Despite a difficult month behind us, it feels reasonable to expect a stronger market during the last quarter of the year. Our view is that we are still in a rising market, although we are likely to experience some turbulence for a few more weeks. "Bear markets" are constantly declining with sharp rallies while "bull markets" continue to rise with some strong drawdowns. We therefore believe that we are still in a rising market.
Some statistics to cheer you up. The S&P500 managed to rise by 0.2 percent in the third quarter (Europe -1.9 percent) which means six consecutive positive quarters. This has only happened eight times before and only on one of the (eight) occasions has the following quarter yielded a negative return. Two quarters later, it has in all cases yielded a positive return. In addition, for the past 20 years, October has been the fourth best month, thus much better than its reputation. Having pointed that out, October takes first place in terms of most frequent daily movements that exceed one percent.
The Stockholm Stock Exchange, which is an excellent reference point, had risen by 30 percent at its highest about a month ago, but is currently at 20 percent. Even more important is that measured in USD, OMX has "only" risen by 13 percent, which is in line with the US stock markets. This is hardly excessive given the profit growth among the companies. The risk premium in the market is high.
Investors are reasonably careless, and we are approaching the turn of the year. Global growth is well above average and interest rates are extremely low. Given how cruel the market has been to many investors this year, with sector rotations and a high concentration of companies driving performance, it almost feels obvious that the broad mass of investors will continue to reduce risk in their portfolios and then be short equities at year-end when the market rises. We'll see, but that's our main scenario right now.

We are now closing the books for the third quarter, and we look forward to the end of the year and above all the entrance for Truecaller on the Stockholm Stock Exchange on October 8!
Thank you for this month and we'll hear from you later.
Mikael & Team
Malmö on 5 October
[/et_pb_text][et_pb_text admin_label="Coeli Nordic Corporate Bond Fund R-SEK" _builder_version="3.0.89" background_layout="light" module_class="gen-table-module" disabled_on="on|on|on" disabled="on"]
Coeli Nordic Corporate Bond Fund
| Performance in Share Class Currency | 1 Mth | YTD | 3 yrs | Since incep |
| Coeli Nordic Corporate Bond Fund - R SEK | 1.30% | -0.93% | 3.38% | 14.52% |
| | | | |
[/et_pb_text][et_pb_text admin_label="Coeli Nordic Corporate Bond Fund R-SEK" _builder_version="3.0.89" background_layout="light" module_class="gen-table-module" disabled_on="on|on|on" disabled="on"]
[cg_linear_graph id="31122"]
[/et_pb_text][et_pb_image _builder_version="3.0.89" src="https://coeli.com/wp-content/uploads//2020/10/ncbr.png" show_in_lightbox="off" url_new_window="off" use_overlay="off" always_center_on_mobile="on" force_fullwidth="off" show_bottom_space="on" disabled_on="on|on|on" disabled="on" /][/et_pb_column][et_pb_column type="1_3"][et_pb_image _builder_version="3.0.89" src="https://coeli.com/wp-content/uploads/2019/01/Gustav-Fransson6.jpg" show_in_lightbox="off" url_new_window="off" use_overlay="off" always_center_on_mobile="on" force_fullwidth="off" show_bottom_space="on" custom_margin="||21px|" disabled_on="on|on|on" disabled="on" /][et_pb_text admin_label="Namn och title" _builder_version="3.0.89" background_layout="light" module_class="gen-single-ingress-module" custom_margin="||40px|" disabled_on="on|on|on" disabled="on"]
Gustav Fransson
Portfolio Manager of Coeli Nordic Corporate Bond Fund
[/et_pb_text][et_pb_image _builder_version="3.0.89" src="https://coeli.com/wp-content/uploads/2018/10/Alexander-Larsson-Vahlman.jpg" show_in_lightbox="off" url_new_window="off" use_overlay="off" always_center_on_mobile="on" force_fullwidth="off" show_bottom_space="on" custom_margin="||21px|" disabled_on="on|on|on" disabled="on" /][et_pb_text admin_label="Namn och title" _builder_version="3.0.89" background_layout="light" module_class="gen-single-ingress-module" custom_margin="||40px|" disabled_on="on|on|on" disabled="on"]
Alexander Wahlman
Senior Analyst
[/et_pb_text][et_pb_text admin_label="Fund Overview" _builder_version="3.0.89" background_layout="light" custom_margin="||20px|" module_class="gen-trustee-single-table"]
Fund Overview
| Inception Date | 2017-12-20 |
| Investment management fee (share class I SEK) | 1.00% p.a + 20% Performance fee (OMRX T-Bill Index) |
| Performance Fee. Yes | 20% |
| Risk category | 5 of 7 |
[/et_pb_text][et_pb_text admin_label="Top Holdings (%)" _builder_version="3.0.89" background_layout="light" custom_margin="||20px|" module_class="gen-trustee-single-table" disabled_on="on|on|on" disabled="on"]
Top Holdings (%)
| LANSBK 1.25% 18-17.09.25 | 4.1% |
| NORDEA HYP 1.0% 19-17.09.25 | 4.1% |
| SWEDBK 1.0% 19-18.06.25 | 4.1% |
| WHITE MOUNT FRN 17-22.09.47 | 3.9% |
| B2 HOLDING FRN 19-28.05.24 | 2.9% |
[/et_pb_text][/et_pb_column][/et_pb_row][/et_pb_section][et_pb_section bb_built="1" fullwidth="off" specialty="off" _builder_version="3.0.89" module_class="gen-trustee-single-yield-section gen-pattern-section" custom_padding="0px|||"][et_pb_row _builder_version="3.0.89" custom_padding="||53px|"][et_pb_column type="4_4"][et_pb_text admin_label="VIKTIG INFORMATION" _builder_version="3.0.89" background_layout="light" module_class="gen-trustee-single-warning-blurb"]
IMPORTANT INFORMATION. This is a marketing communication.
Before making any final investment decisions, please refer to the prospectus of Coeli SICAV II, its Annual Report, and the KID of the relevant Sub-Fund. Relevant information documents are available in English at coeli.com. A summary of investor rights will be available at
https://coeli.com/regulatory-information-coeli-asset-management-ab/.
Past performance is not a guarantee of future returns. The price of the investment may go up or down and an investor may not get back the amount originally invested.
[/et_pb_text][/et_pb_column][/et_pb_row][/et_pb_section]