[et_pb_section bb_built="1" fullwidth="off" specialty="off" _builder_version="3.0.89" background_image="https://coeli.com/wp-content/uploads//2018/08/malmo-bro-comp.jpg" parallax="on" module_class="gen-trustee-single-hero"][et_pb_row][et_pb_column type="4_4"][/et_pb_column][/et_pb_row][/et_pb_section][et_pb_section bb_built="1" fullwidth="off" specialty="off" _builder_version="3.0.89" custom_padding="0px||0px|"][et_pb_row][et_pb_column type="4_4"][/et_pb_column][/et_pb_row][et_pb_row _builder_version="3.0.89" background_position="top_left" background_repeat="repeat" background_size="initial" custom_padding="0px|||" custom_padding_phone="23px|||" custom_padding_last_edited="on|tablet" module_class_2="gen-trustee-single-sidebar" module_class="gen-single-news-content-row "][et_pb_column type="4_4"][et_pb_text admin_label="Tillbaka-knapp" _builder_version="3.0.89" background_layout="light" border_style="solid" custom_margin_tablet="||17px|" custom_margin_last_edited="on|desktop" module_class="gen-back-button hide-in-print"]
Note that the information below describes the share class (I SEK), which is a share class reserved for institutional investors. Investments in other share classes generally have other conditions regarding, among other things, fees, which affects the share class' return. The information below regarding returns therefore differs from the returns in other share classes.
Before making any final investment decisions, please read the prospectus, its Annual Report, and the KID of the relevant Sub-Fund here
[/et_pb_text][et_pb_text admin_label="Tillbaka-knapp" _builder_version="3.0.89" background_layout="light" border_style="solid" custom_margin_tablet="||17px|" custom_margin_last_edited="on|desktop" module_class="gen-back-button hide-in-print" border_style_all="solid"]
This material is marketing communication
[/et_pb_text][et_pb_text admin_label="Datum / Skriv ut" _builder_version="3.0.89" background_layout="light" border_style="solid" custom_margin_tablet="||17px|" custom_margin_last_edited="on|desktop" module_class="gen-single-news-date-module gen-trustee-print-module hide-in-print" locked="on" border_style_all="solid"]
[blog_post_date]
Print
[/et_pb_text][et_pb_text _builder_version="3.0.89" background_layout="light"]
Monthly Newsletter Coeli Absolute European Equity – January 2023
JANUARY PERFORMANCE
The fund’s value increased by 5.3% in January (share class I SEK). The Stoxx600 (broad European index) increased during the same period by 6.7%. At the time of publication of this letter, no data was available for HedgeNordic's NHX Equities.


EQUITY MARKETS / MACRO ENVIRONMENT
The last 5-6 weeks have seen several positive events in the world economy and many of the European companies are now more optimistic compared to last autumn. Europe's stock markets have started the year strongly, which surprised the large investor collective. The image below shows the broad European index which has had its best start since the index was introduced in 1987.

The reasons for greater optimism include: 1) Continued strong order books 2) A maintained pricing power 3) A collapse of energy prices 4) A surprisingly rapid opening up in China, which increases the likelihood that growth will accelerate 5) Continued impressive resilience among companies 6) An inflation that is declining.
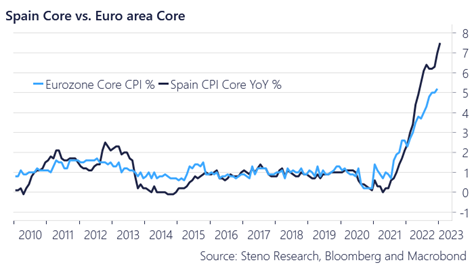
Somewhat of a setback occurred on Monday, January 30, when Spain, which had been the first to show falling inflation in Europe, reported higher than expected inflation - 5.8% against the expected 5.0%. The ECB will with a very high probability raise the key interest rate by another 50bp on February 2
nd.
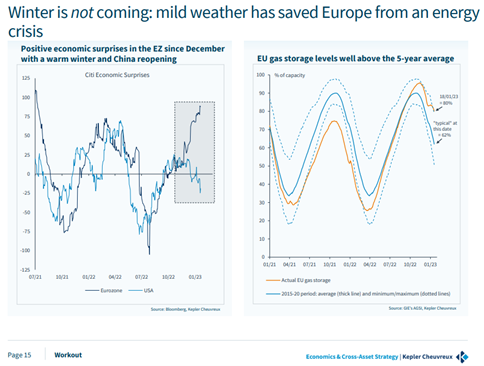
At the end of January several green shoots could be discerned in American and Chinese GDP data for the fourth quarter, which surprised positively. Purchasing indices in both the US, Europe and China were also better than expected. Below left shows Citi's Economic Surprise Index. In recent months, Europe has had significantly more positive news than the US. On the right, the EU's well-filled gas storage is shown.
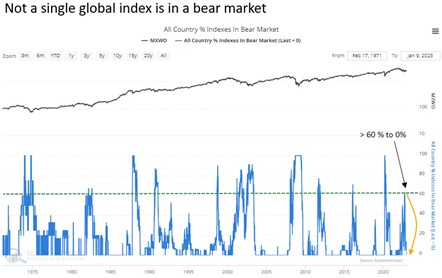
None of the global indices are now (end of January) by definition in a "bear market". A few months ago, 60% of the global indices were in a bear market. Such a development has only occurred 11 times in the last 50 years, see picture below.
 Source: Sentimenttrader
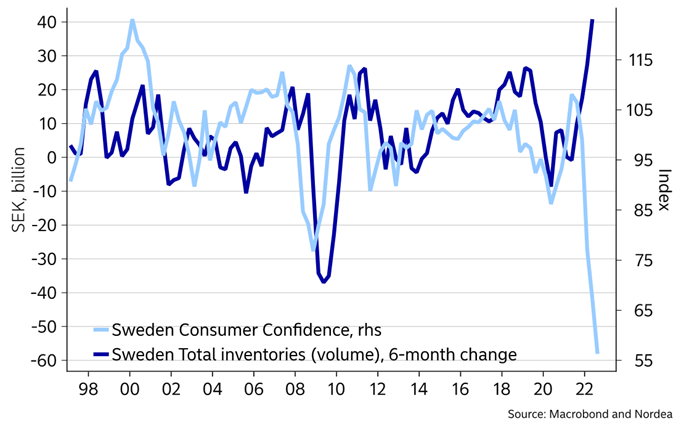
Although many Swedish companies continue to be profitable, it is less cheerful for the country of Sweden. Sweden currently has the highest inflation in the Eurozone and with a chronically weak currency inflationary pressure increases further. Sweden has the sharpest decline in property prices in Europe and an energy system that is dysfunctional in large parts of the country. The consumer is under heavy pressure, see picture below. Sweden ranks fifth in Europe in terms of unemployment after Spain, Turkey, Italy and Greece. However, we have the world's highest marginal tax (source OECD) and Europe's lowest growth in both 2022 and 2023 (source EU Commission). We also have the highest deadly shootings per inhabitant in the EU. How did we end up here?
On Monday, January 30, data was also published for GDP growth in Sweden for the fourth quarter. Growth for the fourth quarter ended at -0.6% against the expected +0.2%. An unusually strong deviation and the Swedish krona came under renewed pressure. In the last 15 months, the krona has fallen against the euro for a full 12 months. A disaster created by the Riksbank and our elected politicians.
US ETFs, which rise in value when the market falls, have had a record inflow in the first few weeks of the year. So far it has been completely wrong, but the year is long.
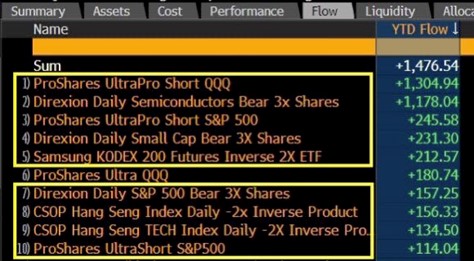 Source: Bloomberg
Undoubtedly, cautious positioning among investors has pushed share prices upwards. Generally speaking, the stocks with the highest proportion of short positions and with a weak development last year have been this year's winners. The blue curve shows the development during the first weeks of the year for the 50 stocks on the American stock exchange that were the most heavily shorted.
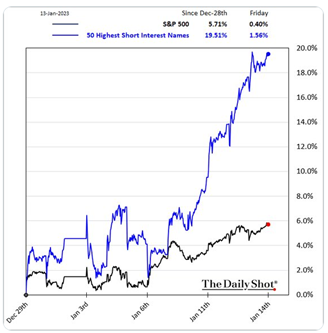 Source: The Daily Shot
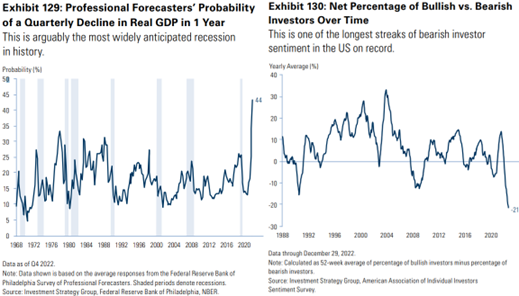
The image on the left below shows that it is the most expected recession since the US Federal Reserve began keeping statistics in 1968. That, combined with a record depressed mood among investors, right-hand image, has contributed to the rise in January. When everyone expects the same thing, it rarely happens. There will of course be occasions for reversals during the year.
"I'm absolutely convinced that this will not happen - Germany going into a recession". This is what German Chancellor, Olaf Scholz, expressed when the world's politicians and business leaders, after a two-year hiatus due to the pandemic, were once again in place in Davos. The IMF took the opportunity to upgrade its outlook of the world economy for 2023. Instead of expecting a tougher climate as previously forecasted, the IMF now expects an improvement in the second half of this year into 2024. German optimism recoiled somewhat when GDP data for the fourth quarter on January 30
th showed a mild contraction of 0.2% against expected unchanged growth.
Below, German business climate index (Ifo) where you can see a clear improvement since the end of last year.
 Source: Bloomberg
At the end of the month, the Lloyds Bank Business Barometer and its UK Business Confidence were also published. Somewhat surprisingly, 2023 has started with the highest optimism in 6 months among UK companies. The companies are more optimistic - they expected to hire slightly more staff at the same time as wage inflation decreased somewhat.
The reasons why the IMF and others are now revising up the growth forecasts for 2023 are, among other things, China's dismantling of strict Covid controls, the US's upcoming giant green investment boom, falling energy prices in Europe, and the fact that, a year after Russia's attack on Ukraine, Europe's companies have adapted to that new reality. The fact that Russia gradually appears to be losing the war surely also plays a role. Russia as a great power does not exist and the only thing the country can do is send in old scrap for weapons that destroy schools, hospitals, residential buildings and injure and kill innocent civilians. There are many of us in the world who are looking forward to the upcoming court hearings with Putin and his entourage on the front row.
The total value of the German stock market (white line) rises relative to American technology companies and now corresponds to, for example, the value of Microsoft and is greater than Google and Amazon respectively.
 Source: Bloomberg
Since the beginning of October, when gas prices began to fall sharply, the American stock market has been significantly weaker than the German one (dark blue line).
 Source: Goldman Sachs
In last month's newsletter, we argued that the heyday of the major American technology companies on the stock market was probably over, partly because of the image below.
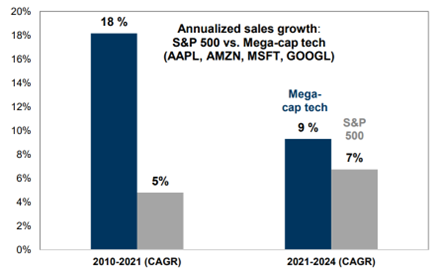 Source: Goldman Sachs
So far it has been wrong as several of the FAANG companies had a very strong start to the year. That Tesla’s share has risen by 41% since the beginning of January is a strong indicator of a rising risk appetite. At the time of writing, the market value of Tesla is approximately SEK 6,000 billion.
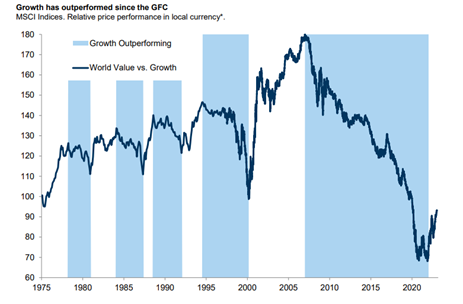
Since the financial crisis 15 years ago, the relative return for growth companies compared to value companies has been enormous. Last year the trend was broken.
 Source: Goldman Sachs
2023 is the Year of the Rabbit and started on January 23rd according to the Chinese calendar. The rabbit is a symbol of a long life, peace and prosperity. We hope for a happy rabbit in 2023.
 Source: Twitter
An interesting picture that shows the economic development of the EU, USA and China. In 2009, the EU was at the top.
 Source: IMF, Bloomberg
Prepare for the US debt ceiling to be discussed in the spring. Soon Treasury Secretary, Janet Yellen, may have to take unusual measures which could include delaying federal employee pensions. Congress must reach an agreement before the summer, which will surely be a duel between Republicans and Democrats. To be continued.
 Source: Bloomberg
At the time of writing, only 25% of the companies in the S&P500 index have reported. Weak reports and clear misses against expectations have initially played less of a role as share prices have risen in the first weeks of the year.
 Source: Goldman Sachs
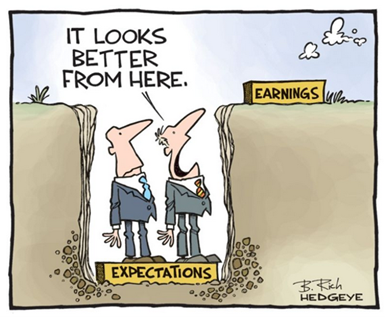
Expectations have come down, but is that enough?
 Source: HEDGEYELong positionsPets at Home
We wrote about Pets at Home as recently as in
our December newsletter. You will find a more detailed description of why we like the company there. In short, the investment thesis is about what we believe to be a high-quality company whose share price has fallen too much because of its shop tag. In the short term, we have been right in our thesis, as the share price rose 24% during the month. Pets at Home thus became the holding that contributed the most to the month's results (just over one percent).
The price rise came after the company released its Q3 report covering October – December. With eight weeks left in the financial year, the company upgraded its full-year profit outlook with around four percent. Comparable store growth rose 8.3% in Q3, compared to 6.8% and 6.0% in the previous two quarters, respectively. We were even more impressed by the growth in the company's veterinary segment, which amounted to a whopping 18%. This is a high-margin business which, over time, will constitute a larger part of the turnover and a disproportionately larger share of the profit.
Interestingly, sales of discretionary products (purchases that are not critical, such as pet food or cat litter) also rose in the third quarter. These products have higher margins than other product categories. Many have believed in a large decline in sales of these high-margin products as the economy worsened, but that has not yet happened. We also note that the business continues to take in more than 20,000 newly registered puppies and kittens a week, well above pre-pandemic levels.
In January, a record number of dogs were newly registered in Sweden. It wasn't quite what we expected after a downward trend last year (even 2022 was strong compared to the years before 2020). We'll see if the January figure is indicative of the rest of the year. If this is the case, it is obviously good for a pet company such as Musti, with its Nordic exposure. But this data can probably also be indicative of Great Britain and thus Pets at Home. Despite a strong price rise since the lows last autumn, we still think the company looks attractively valued.
 Source: Coeli EuropeanCommerzbank
Commerzbank continued its journey during December and was once again one of the fund's top contributors in January. The company disclosed an update at the end of the month where it showed positive EBITDA two years in a row, which is one of the criteria to be included in the DAX 40, where Commerzbank is now a candidate. Preliminary figures were in line with expectations and the full report will come on February 16th. We continue to think that Commerzbank is an interesting restructuring case trading at very low multiples, despite strong profit growth in the coming years. The stock rose 18% in January after rising 10% in December.
 Source: BloombergSLP
Real estate had a good month in January and our holding in SLP was one of the top contributors to the fund's performance in January. There are many indications that SLP is attractively positioned in the coming years. The company has a strong balance sheet which it used to acquire properties from distressed sellers. Almost all leases are indexed to inflation, which mechanically gives +11% in rent growth in 2023. We believe that the yield gap between logistics and other properties will decrease, where SLP with relatively high yield requirements in the valuation should be a relative winner against, for example, housing and offices in big cities that have significantly lower yield requirements.
Bonesupport
Bonesupport had a weak December but bounced back in January to become one of the fund's strongest contributors. There hasn’t been any news, but we look forward to the report coming in February.
Lindab
The Lindab share also had a strong development during January and thus became one of the fund's strongest contributors. After a very weak 2022 where the price was heavily pressured by what appeared to be forced selling, the stock rose 14% in January.
Short positions
The short portfolio contributed negatively during the month. The biggest negative contribution came from our short positions in a Swedish small company index.
Summary
The world's stock markets had a great start to the new year with significant gains. The reasons were, as previously mentioned, several positive and significant news for the world economy combined with extremely gloomy investors with a cautious positioning, and not least a large element of psychology when the annus horribilis, 2022, had finally ended.
Europe continued to develop stronger than the broad indices in the US, even though the Nasdaq rose a whopping 10.6% and thus the index took its first revenge on last year's weak development (-28.7%). The Dow Jones rose by a more moderate 2.8%. As such it was the strongest start for the Nasdaq since 2001. Those who were around at the time will remember that the performance for the full year of 2001 ended at -21% (after falling by 39% year 2000) and was followed by 2002's development with a further -32%. It was the same year that Ericsson came close to bankruptcy, but that's a completely different story.
With January's developments behind us, it is interesting to study the huge selling wave of technology stocks by US private investors over the past year (blue line). In the end, there were no more shares to sell and there was a strong recoil.
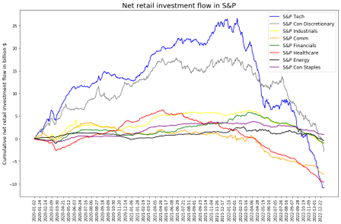 Source: Goldman Sachs
We are satisfied with the fund's return of 5.3%, even though we gave back a little from the intra-month highs. Our companies that reported came with strong numbers and in many cases with significant price reactions in the market (Tate & Lyle and Pets at Home). All company news was positive during the month, and, with some exceptions, all long positions made a positive contribution. Of course, the short positions cost a lot when the market rose.
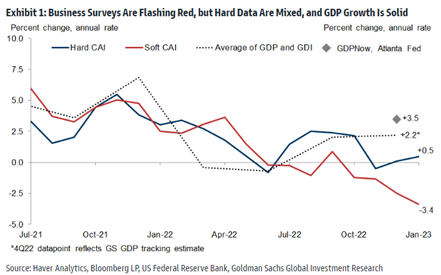
The image below shows that despite various surveys and forecasts that indicate clear declines in the American economy, GDP growth remains strong. Interesting and unusual that it differs so much over such a long period of time. "If the map and reality do not match, the map is the one that applies". An old military joke and so far, many investors have worked from the map.
The Goldman Sachs Financial Conditions index, which is a weighted average of risk-free interest rates, exchange rates, equity valuations and credit spreads, has eased significantly over the past three months. The corresponding change has only happened twice before, first during the financial crisis in 2008 and then during the Covid crash. Positive for risk assets such as stocks.

The money supply in the US has collapsed in recent quarters. That should mean inflation will follow suit (see image below). The last time there was a corresponding sharp decline in the money supply was during the depression of 1929-1930! At the same time, we have the strongest inverted yield curve in over 40 years, one of the most reliable indicators of an impending recession. Consumers are holding back on purchases and many raw materials have fallen sharply. The Fed should soon be able to pause its rate hikes. That they will release the brakes too late feels almost a foregone conclusion.
 Source: trueinsights
In Europe it looks similar, with the difference that we are a few months behind the USA. White line is money supply and yellow bars show inflation.
 Source: Bloomberg, Holger Zschaepitz
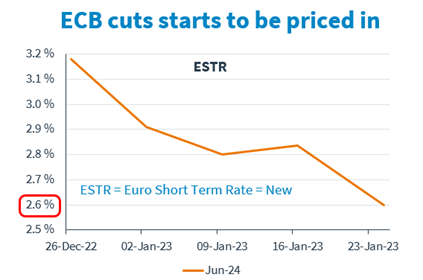
In the past month, the European money market has lowered the forecast for the level of the key interest rate in the summer of 2024. From 3.2% to 2.6% in one month! Even more likely than the Fed in the US, the ECB will act too aggressively and hurt the economy unnecessarily and start tapering too late. It feels a bit like watching a head-on collision in slow motion. The Riksbank's (Swedish Central Bank) actions are like watching a head-on collision in real time. Negative GDP growth in the last quarter and they are still eager to raise interest rates several more times during the year. Less than a year ago, they believed in a zero-interest rate until the second half of 2024.
 Source: Kepler Cheuvreux
The number of people seeking unemployment benefits is another reliable indicator for forecasting an upcoming recession. You can see an increase in the last month in the picture below at the bottom right, but the level is still at very low levels.
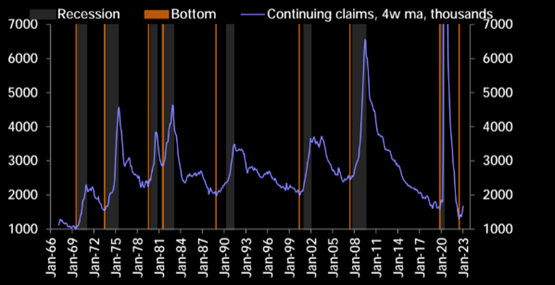 Source: Themarketear.com
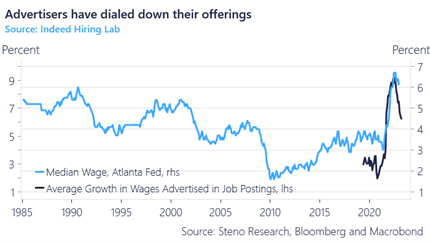
In addition to raw materials and freight rates, wage inflation now also appears to be falling in the US.
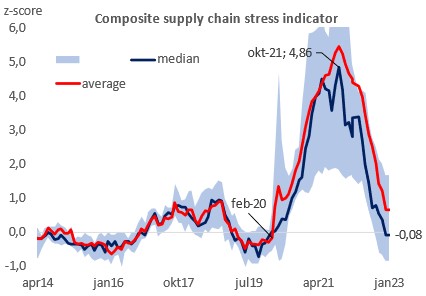
The stress level in terms of delivery problems for various components has come down significantly in the last year and is back to pre-pandemic levels. A very positive development for the world economy, including inflation.
 Source: UBS
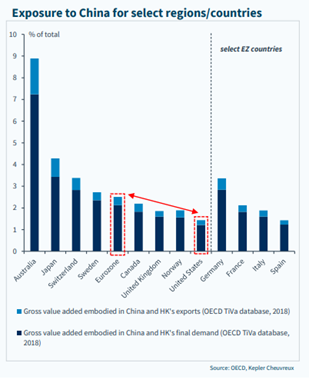
One of the reasons why Europe's stock markets have developed stronger than the US's recently is that China changed its Covid policy. The image below shows the exposure of different countries to China. Germany, which continues to be Europe's engine, has the biggest exposure together with Switzerland (watches). Sweden also stands out, which is positive as people now expect accelerating growth in the Chinese economy.
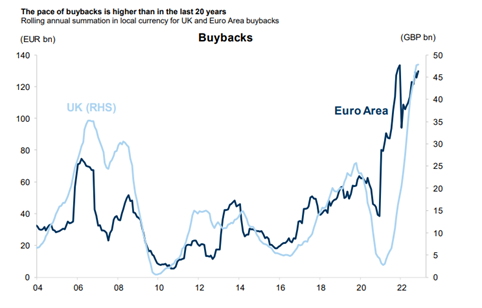
Soon the buyback programs will start again after the companies report for the fourth quarter. The levels in both the US and Europe are still very high.
 Source: Goldman Sachs
Despite a strong start to the year, European valuations are still at very low levels.
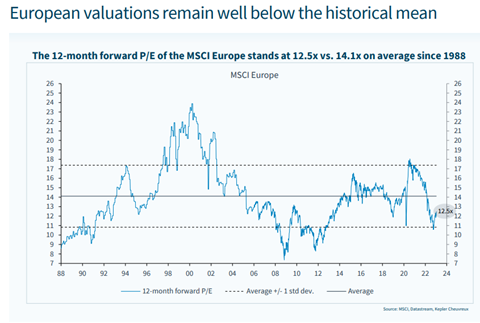 Source: Kepler Cheuvreux
Europe has a large element of undervalued banking and energy stocks. If you adjust for these, you get the adjusted P/E ratio levels below.
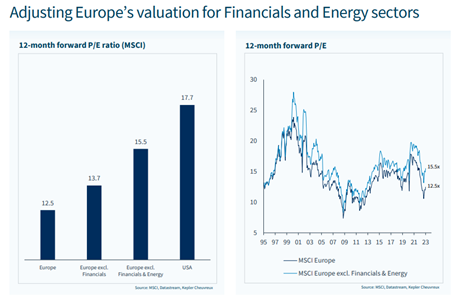 Source: : Kepler Cheuvreux
Below one of the favourite pictures of the month! It shows analysts' EPS revisions two years ahead for European banks since 2010. After 11 dismal years of earnings growth, European banks have finally started delivering profits to their hard-pressed owners. Our own Commerzbank is a shining example of just this. This could be an engine for Europe's stock markets (and economies in general) in the coming years as valuations are still at very low levels. In addition, at the time of writing, major European banks such as Italy's Unicredit and Spain's BBVA have just delivered very strong reports with large capital transfers to owners.
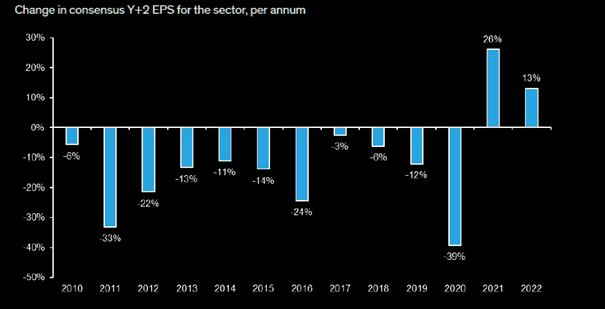 Source: Themarketear.com
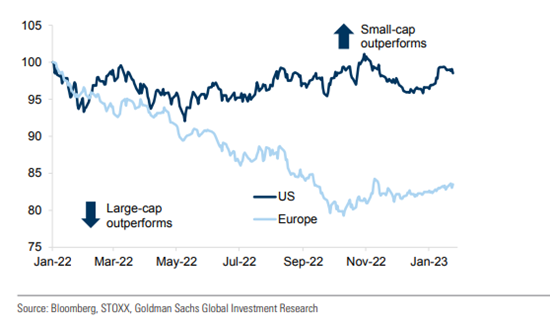
European small companies are gradually starting to recover lost ground from last year. The potential remains significant if we are to return to the same relative valuation as a year ago.
The market does not fall when a recession is confirmed. The last picture for this time shows that stocks normally reach their lowest level 6-9 months before the company's earnings reach their lowest level. The daily discussion in the financial industry is when it intends to appear. Our humble view is that there will be a slowdown in the coming quarters, but that any recession is likely to be mild.
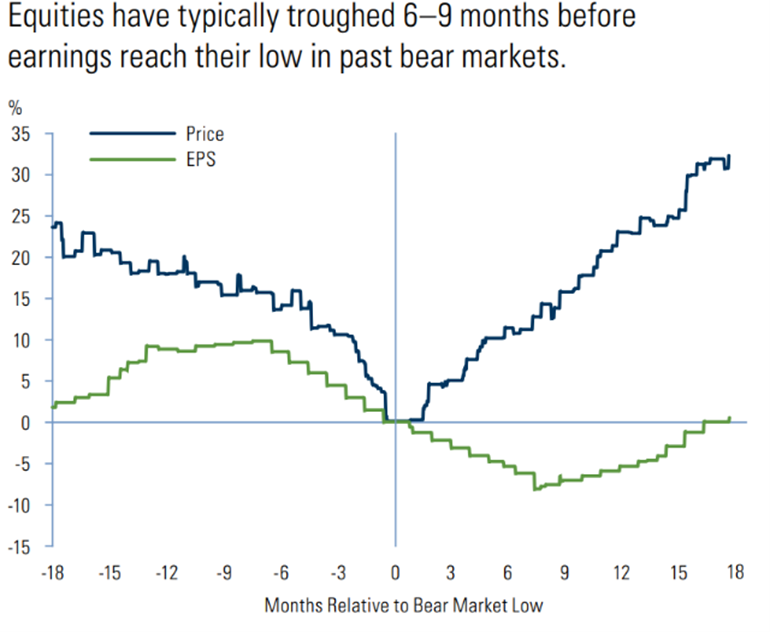
Source: Goldman Sachs
We continue to have a positive view of the stock market, well aware that things went quickly initially. As usual, it is the companies' delivery to their owners that is the most important and we continue to have high pressure in the analysis factory with several new investments underway. February will be a report-heavy month for us, and we look forward to reading all the reports.
We are quickly moving towards brighter times and soon it will be spring!
Mikael & Team
Malmö on 2nd of Febuary2023
[/et_pb_text][et_pb_post_title _builder_version="3.0.89" title="on" meta="off" author="off" date="off" categories="off" comments="off" featured_image="off" featured_placement="below" text_color="dark" text_background="off" border_style="solid" module_class="gen-single-news-heading-module gen-trustee-single-headline" date_format="d M, Y" border_style_all="solid" disabled_on="on|on|on" disabled="on" /][et_pb_text admin_label="Coeli Nordic Corporate Bond Fund R-SEK" _builder_version="3.0.89" background_layout="light" module_class="gen-table-module" disabled_on="on|on|on" disabled="on"]
Coeli Nordic Corporate Bond Fund
| Performance in Share Class Currency | 1 Mth | YTD | 3 yrs | Since incep |
| Coeli Nordic Corporate Bond Fund - R SEK | 1.30% | -0.93% | 3.38% | 14.52% |
| | | | |
[/et_pb_text][et_pb_text admin_label="Coeli Nordic Corporate Bond Fund R-SEK" _builder_version="3.0.89" background_layout="light" module_class="gen-table-module" disabled_on="on|on|on" disabled="on"]
[cg_linear_graph id="31122"]
[/et_pb_text][et_pb_image _builder_version="3.0.89" src="https://coeli.com/wp-content/uploads//2020/10/ncbr.png" show_in_lightbox="off" url_new_window="off" use_overlay="off" always_center_on_mobile="on" force_fullwidth="off" show_bottom_space="on" disabled_on="on|on|on" disabled="on" /][et_pb_image _builder_version="3.0.89" src="https://coeli.com/wp-content/uploads/2019/01/Gustav-Fransson6.jpg" show_in_lightbox="off" url_new_window="off" use_overlay="off" always_center_on_mobile="on" force_fullwidth="off" show_bottom_space="on" custom_margin="||21px|" disabled_on="on|on|on" disabled="on" /][et_pb_text admin_label="Namn och title" _builder_version="3.0.89" background_layout="light" module_class="gen-single-ingress-module" custom_margin="||40px|" disabled_on="on|on|on" disabled="on"]
Gustav Fransson
Portfolio Manager of Coeli Nordic Corporate Bond Fund
[/et_pb_text][et_pb_image _builder_version="3.0.89" src="https://coeli.com/wp-content/uploads/2018/10/Alexander-Larsson-Vahlman.jpg" show_in_lightbox="off" url_new_window="off" use_overlay="off" always_center_on_mobile="on" force_fullwidth="off" show_bottom_space="on" custom_margin="||21px|" disabled_on="on|on|on" disabled="on" /][et_pb_text admin_label="Namn och title" _builder_version="3.0.89" background_layout="light" module_class="gen-single-ingress-module" custom_margin="||40px|" disabled_on="on|on|on" disabled="on"]
Alexander Wahlman
Senior Analyst
[/et_pb_text][et_pb_text admin_label="Top Holdings (%)" _builder_version="3.0.89" background_layout="light" custom_margin="||20px|" module_class="gen-trustee-single-table" disabled_on="on|on|on" disabled="on"]
Top Holdings (%)
| LANSBK 1.25% 18-17.09.25 | 4.1% |
| NORDEA HYP 1.0% 19-17.09.25 | 4.1% |
| SWEDBK 1.0% 19-18.06.25 | 4.1% |
| WHITE MOUNT FRN 17-22.09.47 | 3.9% |
| B2 HOLDING FRN 19-28.05.24 | 2.9% |
[/et_pb_text][/et_pb_column][/et_pb_row][et_pb_row _builder_version="3.0.89" background_position="top_left" background_repeat="repeat" background_size="initial" module_class="gen-single-news-content-row gen-trustee-single-content-row" custom_padding="0px|||" custom_padding_phone="23px|||" custom_padding_last_edited="on|tablet" module_class_2="gen-trustee-single-sidebar" disabled_on="on|on|on" disabled="on"][et_pb_column type="2_3"][et_pb_text admin_label="Tillbaka-knapp" _builder_version="3.0.89" background_layout="light" border_style="solid" custom_margin_tablet="||17px|" custom_margin_last_edited="on|desktop" module_class="gen-back-button hide-in-print" border_style_all="solid"]
Note that the information below describes the share class (I SEK), which is a share class reserved for institutional investors. Investments in other share classes generally have other conditions regarding, among other things, fees, which affects the share class' return. The information below regarding returns therefore differs from the returns in other share classes.
Return to Fund page
[/et_pb_text][et_pb_text admin_label="Datum / Skriv ut" _builder_version="3.0.89" background_layout="light" border_style="solid" custom_margin_tablet="||17px|" custom_margin_last_edited="on|desktop" module_class="gen-single-news-date-module gen-trustee-print-module hide-in-print" locked="on" border_style_all="solid"]
[blog_post_date]
Print
[/et_pb_text][et_pb_post_title _builder_version="3.0.89" title="on" meta="off" author="off" date="off" categories="off" comments="off" featured_image="off" featured_placement="below" text_color="dark" text_background="off" border_style="solid" module_class="gen-single-news-heading-module gen-trustee-single-headline" date_format="d M, Y" border_style_all="solid" /][et_pb_text _builder_version="3.0.89" background_layout="light"]
Utveckling september
Fondens värde sjönk -5,1 procent i september (andelsklass I SEK). Stoxx600 (brett Europaindex) sjönk under samma period med -3,4 procent och HedgeNordics NHX Equities var preliminärt oförändrat. Motsvarande siffror för 2021 är en ökning om +21,6 procent för fonden, +14,0 procent för Stoxx600 och +6,4 procent för NHX Equities.


Equity markets / Macro environment
After seven consecutive months of positive performance the world’s stock markets were poised for some degree of turbulence. Volatility was especially high in some equities and on Monday, September 20, the highest nominal volume ever traded was reached in options on the S&P500 (!) The broad European index fell by 3.4 percent in September compared to the S&P500 which fell by 4.8 percent. The fund also had its first negative performance since October last year with a decline of 5,1 percent. More about that later.
Despite high levels for many stock indices, sentiment among investors has been relatively gloomy. Bank of America's monthly survey recently showed that only 13 percent of managers expect a positive market in the future, which is the lowest figure since April 2020 (and that was clearly wrong). The reasons cited are China's growth problems, the crisis-stricken Chinese real estate giant Evergrande, the development of the delta variant, declining profit growth and, of course, rising inflation. However, they are still overweight equities which is perhaps not so strange when you have to pay to lend your capital to countries. As interest rates rose at the end of the month, the German 10-year interest rate followed with a giant step from - 0.25 percent to - 0.17 percent… The picture below is an overall risk indicator, and we are around zero (neutral).

The news flow in September began with record high inflation figures in Europe at +3.0 which exceeded market expectations. The corresponding figure in July was + 2.2 percent. It was the fastest growth rate since November 2011 and several countries recorded up to five percent in inflation rate. The pressure on the ECB to reduce its support measures is increasing. On Friday, October 1, new inflation figures came in for September, which showed a further acceleration in the inflation rate by +3.4 per cent.
The rate of change can be mostly attributed to rising energy prices that are starting to create real problems in the world's economies as well as agricultural shifts. The picture below shows that food prices are at record high levels over the past 60 years. The biggest losers are the poorest part of the population.

In the slightly longer term it is forecasted that it is not excessive demand that will drive inflation, but rather a limited supply, and then both in terms of products and labour. At the end of September, long queues were reported at petrol stations across the UK when fuel ran out and there were not enough truck drivers to refuel. Prime Minister Boris Johnson urges his citizens to refuel sensibly and at a normal rate. You wanted Brexit, so there you go. In sheer desperation, Johnson has now issued 5,000 temporary short-term visas for temporary drivers. Good luck.
M25 spring 2022?

Below are European gas prices which have risen in a seemingly uncontrolled fashion and recorded the highest September prices ever. A silent prayer for the mild winter. We guess that this development will soon be a major topic in the media, and it will undoubtedly create various problems and somewhat reduce next year's expected growth. It feels reassuring that Per Bolund (Swedish Green Party MP) claims that there is no electricity shortage in Sweden because then the costs for ordinary people would be unbearably high during the winter (which of course they will be). Rising gas and electricity prices have led European politicians to start discussing billion-dollar subsidies (in euros) to households and manufacturers who will experience sharply rising electricity bills over the winter.

Source: Bloomberg
Henrik Svensson, site manager at the oil-fired power plant in Karlshamn (south Sweden), does not agree with Per Bolund that we have a surplus of electricity in the country. For large parts of September, the power plant ran at full capacity and burned 240k liters of oil per hour. Henrik Svensson believes that it is electricity shortages and high electricity prices that are behind the high production. He also says that there is a lack of planned power production in southern Sweden and that it will take many years before the electricity grid is strengthened and new electricity production is in place. Sweden today burns more oil than we have done in 10 years. A gigantic energy policy and climate policy failure signed by the Green Party.

Source: Steget efter
Winning candidate for this year's Christmas presents below.

The change in the US 10-year interest rate created considerable pressure on, primarily, growth stocks at the end of the month. The performance dispersion for different sectors was very large in September with oil shares as a clear winner. This was also felt in the last days of September.

Source: Bloomberg
Below is the development for the US 10-year interest rate. The turbulence in the stock market was caused by the change in interest rate level breaking through on the upside, as can be seen in the chart.

There have been countless attempts to explain the turbulence in recent weeks. The recent and significant amount of options being exercised, Evergrande, interventions by the Chinese government, Fed tapering, Bank of England expected to raise interest rates, delta variant, inflation, bottlenecks in production, difficulties in finding staff, rising energy prices and declining growth rates. We think it is enough to look at the picture below. Rising interest rates hit hard at growth companies' valuations.

Goodbye Mutti and thank you for an extraordinary effort for Europe!

Source: Nyhetsbyrån TT
She was politically in a class of her own during the euro crisis ten years ago and Sweden also has her to thank for a lot. Despite a somewhat weaker performance in recent years, German citizens have experienced significantly better economic development than many others.

On September 29, the covid-19 restrictions in Sweden were finally removed and we can now, in principle, start living a normal life again. The number of bookings for winter holidays skyrocketed to the great joy of the tourist and transport industry. In recent months, tourism activity in the Mediterranean has been "extraordinary" and much better than forecasted before the summer. Luxury travel is also reaching new heights. Private jet passengers to Mallorca increased by +70 percent in July compared to July 2019 with an average of 83 private jets per day landing in Palma. If you want to rent a yacht, you are being referred to next year as basically everything has already been fully booked.
We now belong to a minority group. Passively managed capital exceeds actively managed capital for the first time ever. This will give us more opportunities as mispricing increases.

In addition to being one of the world's best stock markets this year, Sweden also has the most listed companies in the entire EU. Bloomberg drew attention to the fact that there are now around 1,000 listed companies on the various trading platforms in Stockholm. More than 80 percent are smaller companies, and the list is filled with new listings every day until Christmas! For us, it is interesting as we are constantly looking for new potential core holdings. In recent weeks, we have identified one which we write about under Long Positions.
We end this section with a picture that well reflects today's political level.

Source: Kluddniklas
Long positions
Truecaller
During September, we did a lot of work on the Swedish company Truecaller which will go public on October 8th. Truecaller is one of the most interesting companies we’ve seen in recent years. Truecaller has developed a phone application that can, among other things, identify unwanted calls from, for example, telemarketers. The app is one of the top ten most downloaded applications globally, and in some of the main markets such as India, Nigeria and Indonesia, it is one of the three most downloaded apps. As a Swedish company with headquarters in Stockholm, the firm has chosen to list on the Swedish stock exchange, which we are very happy about.
Truecaller was founded in 2009 by Alan Mamedi and Nami Zarringhalam. They met at the Royal Technical University in Stockholm, and they continue to be active in the company as the CEO and Chief Strategic Officer (CSO), respectively. When they released the first version of the app, they received 10,000 downloads within one week. By 2013 they had reached over 10 million users globally and in Q2 2021 they had reached 278 million monthly users. Throughout their journey, Truecaller has attracted several well-known investors such as Sequoia Capital (early investors in Apple, Whatsapp, and Zoom among others), Atomica (Skype-founder Niklas Zennström’s investment company), and Kleiner Perkins (early investors in Google, Amazon, and Spotify among others).

Until recently, revenue streams have mainly consisted of income from in-app advertising. In addition to this, there is a premium version where paying users can get additional functionalities. That business accounted for around 20 percent of revenues in 2020. During the fall of 2020, Truecaller launched a corresponding offering that targets corporates. This part of the business allows B2B customers to be listed as verified callers when they call private people. It can for example be a security company that calls about an alarm or a courier company that needs to get in contact with a receiving customer. It is a common problem that these types of companies get rejected when the call-receiver doesn’t recognize the number.
Truecaller declares that their product benefits from network effects. i.e., the product gets better the more people who use it (think Facebook). This can be relatively easy to appreciate since phone number identification inherently evolves from reporting of unwanted calls by the users, i.e., when enough people have reported an unwanted call Truecaller flags for this in the app). Over time, Truecaller has built a database containing 5.7 billion unique phone-identities. Network effects doesn’t just build a better product over time, they also increase the entry-barriers for potential competition.
The majority of Truecaller’s income comes from developing countries. The company explains that the problems related to spam emails, harassment, unwanted calls, and messages are more common there than in the western world. India is Truecaller’s largest market where these types of problems are significant. One positive aspect of the geographical exposure is that it allows for a nice structural tailwind: the population growth in developed markets is much higher than in the west (driven by an increasing average age) and the smartphone penetration is growing fast.
Historically, 97 percent of all app downloads have been organic. However, management has begun to experiment with user acquisitions by the way of advertisements through, for example, Facebook. The returns on user acquisition looks extremely attractive. In some markets, such as India, Truecaller could achieve a return on investment of up to 20x on every spent dollar. In more mature markets, such as the USA, the same multiple amounts to 4x, still very attractive. Indonesia, which is a relatively new market to the company, has a multiple of 0.8x. This means any user acquisition spend in Indonesia is unprofitable at this point. However, management is confident that the return profile will wander above the 1x as more users join and the network effects take place. In summary, the investment opportunities are plentiful and attractive – and unique.
In summary, several things speak for significant growth in the future. The investment in paid user acquisition, a sharpened premium-offer, the newly launched B2B product and continued growth of the advertising business. In addition to this, acquisitions may likely follow.
Growth has been prioritized over profitability and it is only recently that the company began to report profits. In 2019 sales grew by 57 percent. In 2020 the corresponding figure was 64 percent, and during the first half of 2021 the company’s sales grew with as much as 151 percent in comparison to the same period last year (which was partly affected by the pandemic). During the first half of this year, the company’s operating margin was 32 percent. As you can imagine, Truecaller is very capital-efficient. Working capital is very low which gives a nice cash conversion and a very high return on capital employed – all attributes that are required to create a very successful and valuable company over time.
Truecaller targets a revenue growth of at least 45 percent between 2021-2024e. After 2024 the EBITDA-margin should be at least 35 percent. The sum of the year-on-year growth and the EBITDA-margin should amount to at least 70 percent (a variant of the rule of 40 that tries to balance growth and profitability). We don’t think it will be difficult to reach these targets and the analyst estimates we have looked at are cautious, especially regarding profitability. In our preliminary prognosis for 2023, our EBITDA-estimate is around 16 percent ahead of the analyst estimates that we’ve studied. This is based on that Truecaller can continue to grow sales much faster than hiring new people while the gross margin improves slightly in coming years.
The gross margin is an interesting aspect of the equity story. Truecaller’s gross margin amounts to approximately 70 percent. Most of the cost of sales consists of platform fees to Apple and Google. Since Apple and Google practically control the distribution channels for apps together, a duopoly has occurred and prices for app-developers such as Truecaller have remained high around 25-30 percent of sales. This situation is now heavily criticized from all parts of the world since the situation is not considered competitive, for example
look at this analysis about an American court ruling concerning a twist between Epic Games and Apple. We believe Google and Apple’s fees will decrease over time – which would be a positive event for Truecaller. Furthermore, Truecaller’s new business deal bypasses Goggle and Apple, which gives a gross margin of close to 100 percent. This will strengthen the profitability even more.
There are of course risks associated with the dependence on Google/Apple (which is the case for every company in the application business); the geographical exposure and one should never write off the threat of competition even if it seems far away at this stage. However, we do believe the benefits outweighs the negatives. Truecaller has excellent financial characteristics, operational founders with large shareholdings who will remain active in the business and some of the world’s most well-known investors behind it. We therefore look forward to being included as an anchor investor ahead of the stock exchange listing on October 8th. We are even more excited to follow the company’s successes in current and new markets in the coming years.
CVS Group
One of the happiest days of the month was when our veterinarian company CVS Group released their interim numbers. Once again, the company beat analysts’ expectations which have been raised several times over the course of the year. In the first two months of the new financial year (which begins in July), the company has grown by 17 percent. This can be compared with the growth expectations for the full year which, before the report release, were 7 percent. Once again, analysts have thus far been “forced” to upgrade their assumptions. In a sour September stock market, the share fell 3 percent.
It becomes clear that the positive effect of the pandemic on pet ownership is more tenacious than ever. Pets live for many years, and we believe many underestimated the importance of the large number of new customers during the pandemic. Below is a graph of Google searches for veterinarians in the UK as well as data from the Swedish Board of Agriculture regarding the number of newly registered dogs. We speculate that the UK has similar trends as Sweden. The data points are also positive for our other pet company Swedencare. Pet companies are obviously still hot; right now there’s a bidding war going on over the German pet company Zooplus, where EQT is currently in the lead with the highest bid. We also note that there have been several venture capital-led acquisitions of veterinary companies at higher multiples than CVS is valued at.

Source: Jordbruksverket, Coeli

Source: Google Trends, Coeli
Lindab
Since our first investments in Lindab in the autumn of 2019, the thesis has always been that the building systems business segment did not fit into the business and in September, management finally found a buyer for the company. The transaction entails a write-down of goodwill corresponding to SEK 430 million, but it is cash flow neutral. Lindab took the opportunity to update its financial targets; the company now wants to grow by 10 percent per year (of which approximately two thirds are through acquisitions) and reach an operating margin of at least 10 percent (previously 10 percent over a business cycle). The share responded positively to the message.
We noted broad insider purchases in Lindab during the month, also from CEO Ola Ringdahl himself, which we think bodes well for the report in October. Despite this the share price decreased 8 percent in September.
Victoria
We have written several times about the British flooring company Victoria, which in September had a weak share price development of 17 percent. By all accounts, the company is doing well – during the month it was reported that sales rose 70 percent compared to 2020, and 50 percent compared to 2019. If you only partially extrapolate these figures for the rest of the year, it is obvious that analysts’ expectations are too low. We believe that this month’s decline is related to flows: growth companies and small and mid-cap companies were some of the most affected sectors in September – Victoria was hit from both sides. We have increased our position in recent days.
The Pebble Group
One of the month’s (few) joys was Pebble Group. As we previously wrote, the company is active in the market for gift advertising, i.e. gifts that companies give to customers, employees, and other stakeholders for marketing purposes. In September the company came out with its half-year figures that were better than expected. Pebble’s software division, Facilisgroup, is growing better than our expectations. This is also the part we believe the market is valuing too low. The stock rose 10 percent in September.
Knaus Tabbert
During the last trading day in September, our German motorhome manufacturer Knaus Tabbert announced that the forecasts for 2021 must be lowered due to component shortages. We are not particularly surprised that this has happened given what we have seen from other vehicle manufacturers. If the company can remedy these supplier problems, management believes that 2022 will be unaffected at best, as Knaus still has a bursting order book, increased production capacity and more suppliers from January next year. The share fell 7 percent in September.
Short positions
The short portfolio contributed with a negative result during the month. Our short-term negative positions in the German DAX had the largest negative contribution. Some stock specific short positions that contributed positively to the result were Swedish Dometic, German Henkel and Norwegian NEL.
Exposure
The net exposure, adjusted for our unlisted holdings, at the beginning and end of the month was 76 and 74 percent, respectively.
Summary
September's negative return of x percent also meant the end of the fund's, so far, longest period of positive return (10 months). We are obviously disappointed with that, but we have been in the game long enough to understand that equities sometimes must fall to be able to refuel and continue their upward trajectory. In general, September was the weakest month for many equities since the crisis started 1.5 years ago. September, otherwise, started strong for us and was a continuation of an unusually good performance at the end of August. Our companies presented many good news (except for Knaus Tabbert on the last day of the month) but small-caps and especially those categorized as growth shares, had a very weak performance during September. The main reason for this was, as previously mentioned, the change in the US long-term interest rate and general "risk off".
The picture below shows the development since March last year compared with the corresponding time intervals in the financial crisis in 2009 and onwards. Both periods have shown an unusually strong recovery and the current trend is even stronger than when the financial crisis raged 12 years ago.

Source: Goldman Sachs
Since the crisis started 1.5 years ago, we have had three different phases. The first and shortest, "despair", showed a decline in prices of 33 percent. The second phase, "hope", ended at the beginning of this year and showed a very strong return of 79 percent despite declining earnings. The last, “growth”, where we are now, has shown +11 percent in share prices with sharply rising growth for companies' earnings, but at lower valuations.

Source: Goldman Sachs
The recovery for American companies (below) has been extremely strong and compared to 2019, the 2021 profits will be approximately 36 percent higher. Very impressive.

Source: Goldman Sachs
It is very gratifying that Europe, for once, is keeping up with the United States and showing strong profit growth. Compare this with the non-existent profit growth between 2007–2019 (!)

Despite rising equity prices, valuations have fallen and Europe is now trading around 16x the profit 12 months ahead. It's not very strenuous (we think). For an average commercial property, you can get a return of maybe 3 percent before net financial costs. After financing, this corresponds to at least P/E 50x. And paying to lend to different countries does not feel like an exciting alternative either.

Source: Goldman Sachs
The valuation of global shares in relation to global GDP looks more strained. A major reason for this is the central banks' aggressive policy.

The valuation of the major leading technology companies is at an average level seen from the last five years.

Source: Goldman Sachs
The image below is striking. It shows that Swedish property prices, which have risen by almost 200 percent over the past 15 years, have had the same development as the money supply. In theory, price per m2 and krona is unchanged for the past 15 years. Is there anyone who still doubts that the world's central banks are responsible for the largest wealth creation in human history? It is important to be on the wagon because when it is gone you’ve missed it. And what central banks cannot push, the price of bitcoin for example, rises even more as central banks cannot make more of it. The opportunities for central banks to reverse the band are few. In the long run, this means that the next 10 years will, overall, be a good period for, for example, stock picking. All forms of uniqueness (growth) will be highly valued to compensate for the fact that the value of money decreases at a rapid pace.

If there is anyone who is still not convinced, take a look at the picture below. The market capitalization of the S&P500 divided by the Fed's balance sheet….

Source: Bloomberg
Onwards and upwards. The wealth of American households is accelerating away from the change in GDP.

Thank you Fed and all the world central banks!

Citigroup's surprise index has weighed down and analysts' profit estimates are also starting to soften. Not a good combination and it has undoubtedly contributed to the weak development in the stock markets recently.

It took a full 219 days for the S&P500 to have a decline of 5 percent. We will see how high the next bar will be.

Timing is everything. A fascinating graph that shows the importance of having reasonable timing in decisions.

Source: Goldman Sachs
Despite a difficult month behind us, it feels reasonable to expect a stronger market during the last quarter of the year. Our view is that we are still in a rising market, although we are likely to experience some turbulence for a few more weeks. "Bear markets" are constantly declining with sharp rallies while "bull markets" continue to rise with some strong drawdowns. We therefore believe that we are still in a rising market.
Some statistics to cheer you up. The S&P500 managed to rise by 0.2 percent in the third quarter (Europe -1.9 percent) which means six consecutive positive quarters. This has only happened eight times before and only on one of the (eight) occasions has the following quarter yielded a negative return. Two quarters later, it has in all cases yielded a positive return. In addition, for the past 20 years, October has been the fourth best month, thus much better than its reputation. Having pointed that out, October takes first place in terms of most frequent daily movements that exceed one percent.
The Stockholm Stock Exchange, which is an excellent reference point, had risen by 30 percent at its highest about a month ago, but is currently at 20 percent. Even more important is that measured in USD, OMX has "only" risen by 13 percent, which is in line with the US stock markets. This is hardly excessive given the profit growth among the companies. The risk premium in the market is high.
Investors are reasonably careless, and we are approaching the turn of the year. Global growth is well above average and interest rates are extremely low. Given how cruel the market has been to many investors this year, with sector rotations and a high concentration of companies driving performance, it almost feels obvious that the broad mass of investors will continue to reduce risk in their portfolios and then be short equities at year-end when the market rises. We'll see, but that's our main scenario right now.

We are now closing the books for the third quarter, and we look forward to the end of the year and above all the entrance for Truecaller on the Stockholm Stock Exchange on October 8!
Thank you for this month and we'll hear from you later.
Mikael & Team
Malmö on 5 October
[/et_pb_text][et_pb_text admin_label="Coeli Nordic Corporate Bond Fund R-SEK" _builder_version="3.0.89" background_layout="light" module_class="gen-table-module" disabled_on="on|on|on" disabled="on"]
Coeli Nordic Corporate Bond Fund
| Performance in Share Class Currency | 1 Mth | YTD | 3 yrs | Since incep |
| Coeli Nordic Corporate Bond Fund - R SEK | 1.30% | -0.93% | 3.38% | 14.52% |
| | | | |
[/et_pb_text][et_pb_text admin_label="Coeli Nordic Corporate Bond Fund R-SEK" _builder_version="3.0.89" background_layout="light" module_class="gen-table-module" disabled_on="on|on|on" disabled="on"]
[cg_linear_graph id="31122"]
[/et_pb_text][et_pb_image _builder_version="3.0.89" src="https://coeli.com/wp-content/uploads//2020/10/ncbr.png" show_in_lightbox="off" url_new_window="off" use_overlay="off" always_center_on_mobile="on" force_fullwidth="off" show_bottom_space="on" disabled_on="on|on|on" disabled="on" /][/et_pb_column][et_pb_column type="1_3"][et_pb_image _builder_version="3.0.89" src="https://coeli.com/wp-content/uploads/2019/01/Gustav-Fransson6.jpg" show_in_lightbox="off" url_new_window="off" use_overlay="off" always_center_on_mobile="on" force_fullwidth="off" show_bottom_space="on" custom_margin="||21px|" disabled_on="on|on|on" disabled="on" /][et_pb_text admin_label="Namn och title" _builder_version="3.0.89" background_layout="light" module_class="gen-single-ingress-module" custom_margin="||40px|" disabled_on="on|on|on" disabled="on"]
Gustav Fransson
Portfolio Manager of Coeli Nordic Corporate Bond Fund
[/et_pb_text][et_pb_image _builder_version="3.0.89" src="https://coeli.com/wp-content/uploads/2018/10/Alexander-Larsson-Vahlman.jpg" show_in_lightbox="off" url_new_window="off" use_overlay="off" always_center_on_mobile="on" force_fullwidth="off" show_bottom_space="on" custom_margin="||21px|" disabled_on="on|on|on" disabled="on" /][et_pb_text admin_label="Namn och title" _builder_version="3.0.89" background_layout="light" module_class="gen-single-ingress-module" custom_margin="||40px|" disabled_on="on|on|on" disabled="on"]
Alexander Wahlman
Senior Analyst
[/et_pb_text][et_pb_text admin_label="Fund Overview" _builder_version="3.0.89" background_layout="light" custom_margin="||20px|" module_class="gen-trustee-single-table"]
Fund Overview
| Inception Date | 2017-12-20 |
| Investment management fee (share class I SEK) | 1.00% p.a + 20% Performance fee (OMRX T-Bill Index) |
| Performance Fee. Yes | 20% |
| Risk category | 5 of 7 |
[/et_pb_text][et_pb_text admin_label="Top Holdings (%)" _builder_version="3.0.89" background_layout="light" custom_margin="||20px|" module_class="gen-trustee-single-table" disabled_on="on|on|on" disabled="on"]
Top Holdings (%)
| LANSBK 1.25% 18-17.09.25 | 4.1% |
| NORDEA HYP 1.0% 19-17.09.25 | 4.1% |
| SWEDBK 1.0% 19-18.06.25 | 4.1% |
| WHITE MOUNT FRN 17-22.09.47 | 3.9% |
| B2 HOLDING FRN 19-28.05.24 | 2.9% |
[/et_pb_text][/et_pb_column][/et_pb_row][/et_pb_section][et_pb_section bb_built="1" fullwidth="off" specialty="off" _builder_version="3.0.89" module_class="gen-trustee-single-yield-section gen-pattern-section" custom_padding="0px|||"][et_pb_row _builder_version="3.0.89" custom_padding="||53px|"][et_pb_column type="4_4"][et_pb_text admin_label="VIKTIG INFORMATION" _builder_version="3.0.89" background_layout="light" module_class="gen-trustee-single-warning-blurb"]
IMPORTANT INFORMATION. This is a marketing communication.
Before making any final investment decisions, please refer to the prospectus of Coeli SICAV II, its Annual Report, and the KID of the relevant Sub-Fund. Relevant information documents are available in English at coeli.com. A summary of investor rights will be available at
https://coeli.com/regulatory-information-coeli-asset-management-ab/.
Past performance is not a guarantee of future returns. The price of the investment may go up or down and an investor may not get back the amount originally invested.
[/et_pb_text][/et_pb_column][/et_pb_row][/et_pb_section]