[et_pb_section bb_built="1" fullwidth="off" specialty="off" _builder_version="3.0.89" background_image="https://coeli.com/wp-content/uploads//2018/08/malmo-bro-comp.jpg" parallax="on" module_class="gen-trustee-single-hero"][et_pb_row][et_pb_column type="4_4"][/et_pb_column][/et_pb_row][/et_pb_section][et_pb_section bb_built="1" fullwidth="off" specialty="off" _builder_version="3.0.89" custom_padding="0px||0px|"][et_pb_row][et_pb_column type="4_4"][/et_pb_column][/et_pb_row][et_pb_row _builder_version="3.0.89" background_position="top_left" background_repeat="repeat" background_size="initial" custom_padding="0px|||" custom_padding_phone="23px|||" custom_padding_last_edited="on|tablet" module_class_2="gen-trustee-single-sidebar" module_class="gen-single-news-content-row "][et_pb_column type="4_4"][et_pb_text admin_label="Tillbaka-knapp" _builder_version="3.0.89" background_layout="light" border_style="solid" custom_margin_tablet="||17px|" custom_margin_last_edited="on|desktop" module_class="gen-back-button hide-in-print" border_style_all="solid"]
Note that the information below describes the share class (I SEK), which is a share class reserved for institutional investors. Investments in other share classes generally have other conditions regarding, among other things, fees, which affects the share class' return. The information below regarding returns therefore differs from the returns in other share classes.
Before making any final investment decisions, please read the prospectus, its Annual Report, and the KID of the relevant Sub-Fund here
[/et_pb_text][et_pb_text admin_label="Tillbaka-knapp" _builder_version="3.0.89" background_layout="light" border_style="solid" custom_margin_tablet="||17px|" custom_margin_last_edited="on|desktop" module_class="gen-back-button hide-in-print" border_style_all="solid"]
This material is marketing communication
[/et_pb_text][et_pb_text admin_label="Datum / Skriv ut" _builder_version="3.0.89" background_layout="light" border_style="solid" custom_margin_tablet="||17px|" custom_margin_last_edited="on|desktop" module_class="gen-single-news-date-module gen-trustee-print-module hide-in-print" locked="on" border_style_all="solid"]
[blog_post_date]
Print
[/et_pb_text][et_pb_text _builder_version="3.0.89" background_layout="light"]
Monthly Newsletter Coeli European – December 2023
DECEMBER PERFORMANCE
The fund’s value increased by 6.3% in December (share class I SEK), while the benchmark increased by 3.1%. Since the change of the fund’s strategy at the beginning of September this year, the fund’s value has increased by 6.8% compared to a decrease of the benchmark by 1.5%. Both measured in SEK.
 *Adjusted for spin-off of Rejuveron.** AEE: Absolute European Equity, CE: Coeli European, Benchmark: MSCI Europe SMID Cap Net Total Return SEK.Please Note: On the 4th of September 2023, the strategy of the fund officially changed from a European long biased equity long/short fund to a European active long only fund. Simultaneously, the name changed from Coeli Absolute European Equity to Coeli European. The track record highlighted in colour in the table above is that of Coeli Absolute European Equity.
EQUITY MARKETS / MACRO ENVIRONMENT
The year ended sour for most asset classes. In the FX market, the US dollar continued to weaken against the euro which is typically good for risk appetite. The Swedish krona had the opposite movement and continued its remarkable recovery, which also reflects increased risk-taking. Both of these currencies began their respective reversals in mid-October which was concurrent with the beginning of the world’s stock markets strong rally. Oil plummeted at the same time, from around $90 a barrel to $76 10 weeks later. Most notable, and the trigger for all of the above, was the US 10-year treasury note which fell from 5% to 3.87% on the last day of the year. Unbelievable!
The fund had another strong month with a positive return of 6.3% and since we changed our strategy on September 4th, we have generated an excess return of 8.3%. Developments for other relevant indices in December were Stoxx600 +3.8%, Nasdaq +5.5% and MSCI SMID +7.0%, all measured in local currencies. The fund's return during the autumn has benefited from our overall macro view, which included falling inflation and interest rates. This, in particular, has fuelled the valuation increase of small and medium-sized companies from low levels but as common in a concentrated portfolio it is the selection and composition of companies that has been vital.
After a very strong November, the fund's biggest short-term risk at the beginning of December was that our holdings would retract. Until December 8th, it was quiet with few company and macro news stories. On the afternoon of December 8th, US labor market data was released showing unemployment at a low 3.5%, versus expectations of 3.7%. Interest rates shot up immediately and some turbulence was also felt in the FX market. For three days we were not in sync with the rest of the market, but when Fed Chairman, Jerome Powell, began his press conference on the evening of December 13th, he was surprisingly soft in tone and the stock markets began to rise. On the morning of December 14th, Swedish inflation data was published and it was as good as we had hoped for. From that point until the end of the year, we generated our entire December return and adjusted for our spin-off of Rejuveron, the fund rose by 8.8 percent in 2023. Since the lowest level in October, the fund returned approximately 25% and contributions came from all corners. Several price reactions that stand out during that period are Bonesupport with 65%, Cargotec with 48%, Carel with 38% and Corem with a modest 100% (!)
Most people have probably been surprised by the strength of the stock market in 2023. Despite a limited profit growth, the annual return was good and the biggest chunk came from an expansion in multiples. The image below shows where the returns came from in the US market.
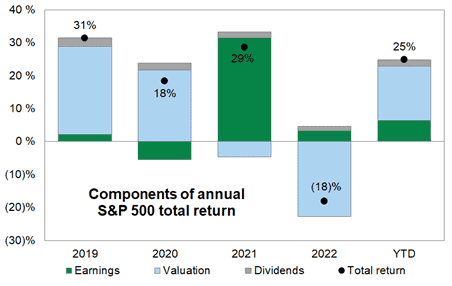 Source: Goldman Sachs
During the year the fund has had an overexposure to Sweden with an exposure in recent months of around 35%. There are several reasons for this, but the main one is that Sweden is our home market and we like to think we have an edge there because of that. In addition, it is a market that has many interesting companies and from a European perspective is clearly the leader in terms of technology companies. As an asset class, small companies and in particular Swedish ones has, since January 2 2022, 22 months ago, been frozen out while inflation and interest rates have rocketed but is now finally starting to thaw. When we review the December events, it can be concluded that Sweden was probably the world's best stock market during the last month of the year with +12% for OMX30 (Stockholm Stock Exchange) measured in USD.
Below is December returns across various regions. The penultimate column to the right measured in local currency and final column to the right measured in euros. Note the difference in Sweden between SEK and EUR returns.
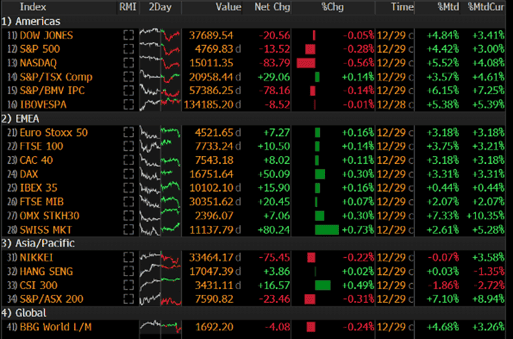 Source: Bloomberg
A strong recovery for a severely battered Swedish real estate sector helped drive returns. Of the 10 best real estate stocks in the Stoxx600 last year, half were Swedish. That says a lot about how underweighted and shorted the Swedish real estate companies have been. Our own holdings in SLP and Corem had an annual return of 33% and roughly 34%respectively (including dividends). The companies have completely different profiles and risk levels, but the returns were roughly the same. Adjusted for volatility, SLP was the clear winner, likely across all of Europe. During the year, we had an overexposure to the real estate sector (a total of 11%of the fund). A mistake on our part was that we were invested too early, as the sector, especially in the first half of the year, was under pressure. However, we were more than compensated in the second half of the year, especially in November and December. Our view of the real estate sector ahead of 2024 remains positive, driven by a falling interest rate. We're happy to note that Blackstone invested more in European real estate than any other geographic region in 2023. They also say they have an additional $40 billion to invest.
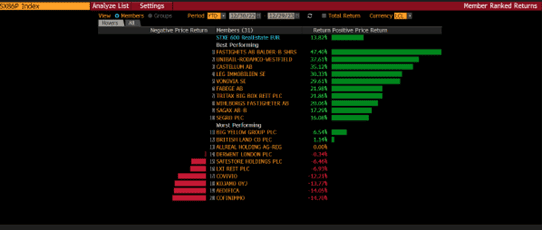 Source: Bloomberg
Hop on the bandwagon! After the Fed meeting on December 13th, Wall Street's largest and oldest ETF, SPY (S&P500) received the largest inflow ever. Almost USD 20.8 billion was received in one day and USD 24 billion in one week which was the biggest weekly inflow in 30 years. This created some pressure in the market.
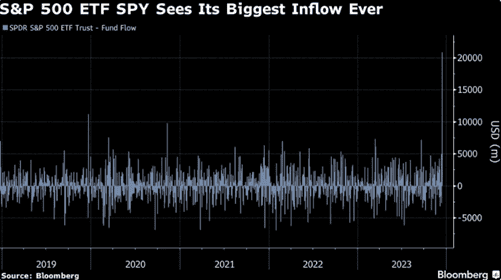 Source: Bloomberg
Further evidence of beta hunting came in the options market. Never before has the volume of call options been higher than on December 14th - 42 million contracts.
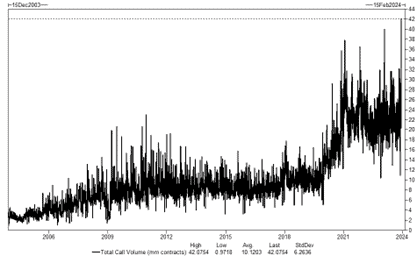 Source: Goldman Sachs
A lot of financial history was made in December. The Russell 2000 technology index outperformed the broad Nasdaq index by 3.3% points on December 13th , which was the sixth-largest difference in more than 20 years. The Russell 2000 set a new 52-week high after making a 52-week low just 48 days earlier. It was the shortest turnaround time in the index's history, which dates back to the 1970s. Unbelievable.
The Fed's clear change of tone created big losses in certain places. The difference between the returns of Jefferies' hedge fund clients' long and short positions was -11.5% over two days in December (13-14th)! The second worst performance in 10 years and only the time when Gamestop (remember the madness?) was up 355%in two days was worse.
 Source: Jefferies, Bloomberg
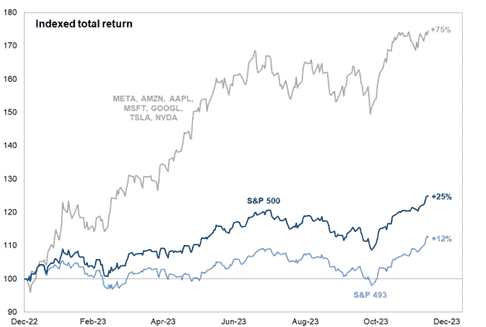
The breadth of the stock market improved significantly during the fourth quarter. In the US, the concentration was sky high with the big technology companies as the superior winners, but at the end of the year more stocks started to participate in the rise. In mid-December, the S&P500 rose for one day while all of the Magnificent7 fell. That had not happened since July 2022 and it was becoming increasingly clear that investors were beginning to change their minds about an imminent recession. The image below shows the Goldman Sachs Breadth Index for the US market. Corresponding developments were also seen in Europe.
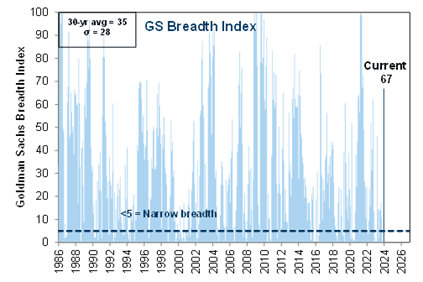 Source: Goldman Sachs
Investors continue to ignore weak activity indicators (PMI) and have increased sharply to cyclical companies at the expense of more defensive companies. Worth noting is that January 3rd this year had its worst cyclical day against defensive companies since August last year, but the year is still long.
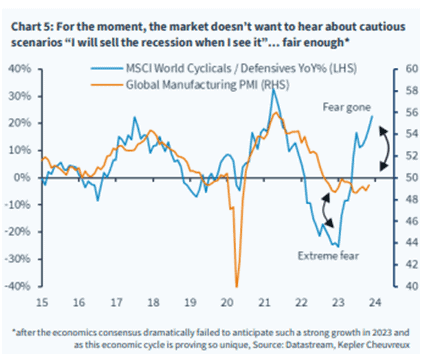 Source: Datastream, Kepler Cheuvreux
To put things in perspective. The image below shows the weight in the MSCI world index, for the large technology companies on the left and for some countries on the right. Apple's weight is almost as large as all the companies in Japan, and Alphabet's weight is roughly the weight of all the companies in Great Britain. Almost unimaginable.

Much has been written about the progress of the big tech companies in 2023 so we won't bore you too much, but they are important to the world's stock markets. Most people have probably forgotten that Nasdaq had a super-heavy 2022 with -33% in return. Viewed over two years, the recovery is almost perfect and complete, having risen by a whopping 43% in 2023, second best to the memorable 1999, and thus has had a positive return 14 out of 15 years. The total development since the financial crisis in 2008 is 1517%…
 Source: Bloomberg
Same message broken down at company level. The return over two years feels more remarkable than last year in isolation. Collectively, over two years, the yield has been a modest 3.5%.
 Source: @CharlieBilello
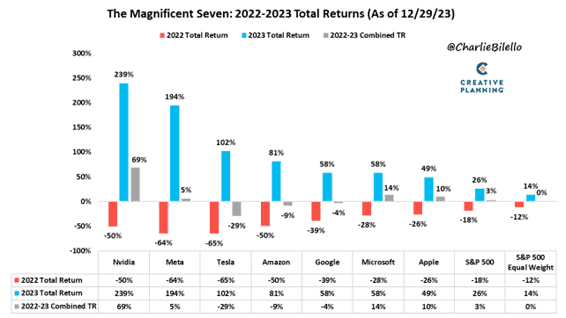
But 2023 was phenomenal for Magnificent7. A rarely seen concentration of returns from seven companies compared to the other 493 included in the S&P500.
 Source: Goldman Sachs
A large part of the explanation for the difference in returns is shown in the image below. Impressive to say the least.
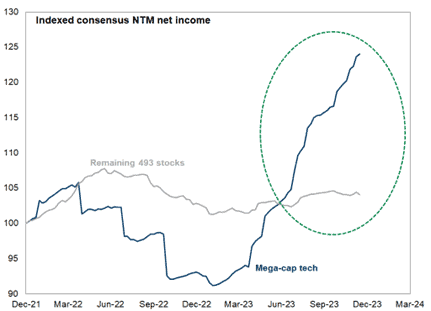 Source: Goldman Sachs
We note that our view a year ago that the large technology companies were unlikely to deliver any significant returns in 2023 was completely wrong. Lucky that our focus is not American technology companies.
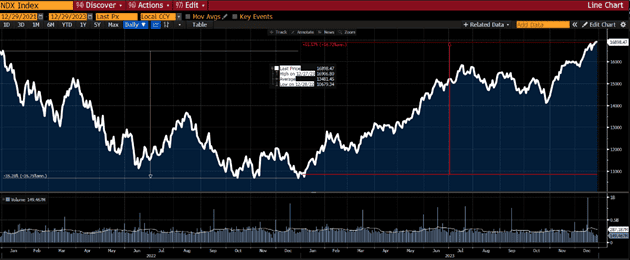
Despite all the drama and stress, the American 10-year treasury note closes at 3.87%, exactly at the same level as it was on the last day of the year in 2022! How is that possible? Almost like a bad movie and you do best to avoid thinking about all the stress caused by the development last year when the level was unchanged a year later.
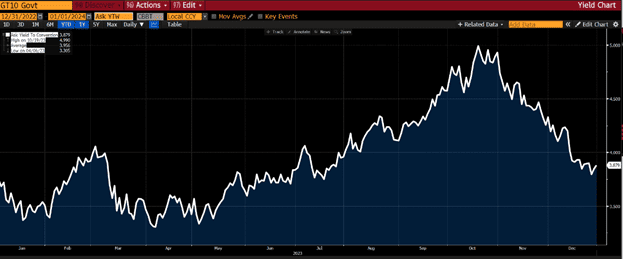 Source: Bloomberg
The war on inflation is over (at least for now). A razor-sharp image that captures much of the extreme drama we have all experienced in the past two years with historically very strong interest rate increases.
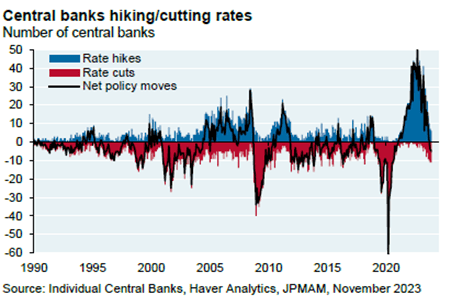 Source: Individual Central Banks, Haver Analytics, JPMAM
Price pressure falls significantly within the Eurozone.
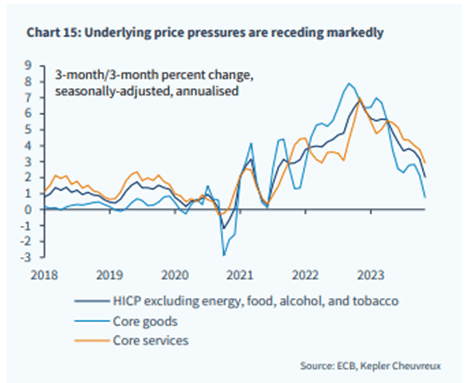 Source: ECB, Kepler Cheuvreux
Falling prices lead to the next important picture that explains much of last year's strong performance in the stock market. In the US, we are impressed by the symbiosis between the Fed and the US economy. In Sweden, we can take our hats off to Erik Thedéen's work since he took office as Governor at the Swedish Central Bank. The starting position was grim, but most things have gone in the right direction. In most parts of the world, inflation continues to fall back and soon it is likely and hopefully close to the target levels.
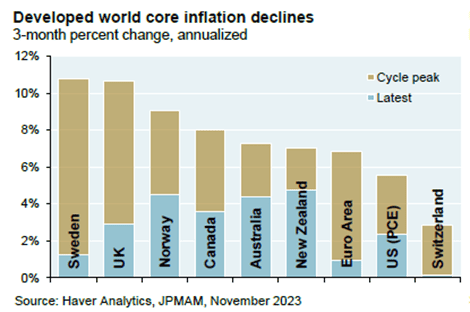 Source: Haver Analytics, JPMAM
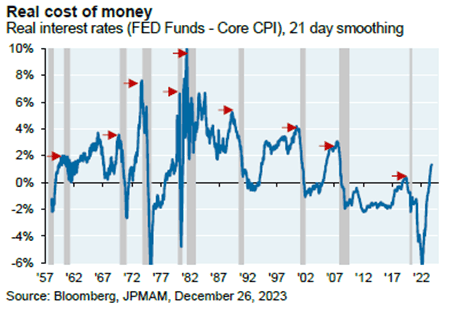
This has contributed to falling real interest rates. If one zooms out it shows that German real interest rates were in positive territory only for a short period. The German 10-year government bond is now below 2%, which is the same level as inflation expectations.
 Source: Holger Zschaepitz
Illustrated differently and for the United States. Financial conditions have improved rapidly.
 Source: Bloomberg, JPMAM
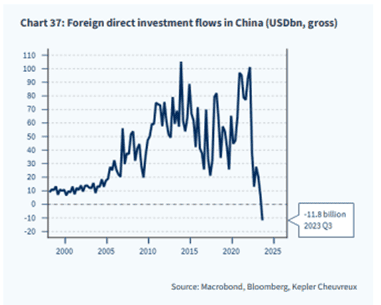
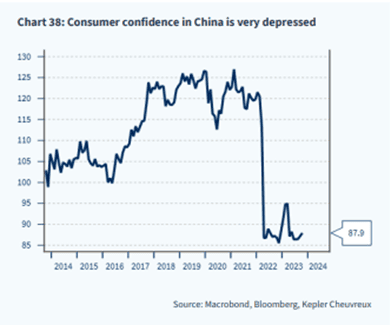
We must also mention China when summarising the past year. After a deranged Covid policy, the country finally opened up at the beginning of last year. Hopes were high for a kick start, but it turned out to be more of a melancholy deflation. Geopolitical tensions and all the logistical problems that arose as a result of the extreme Covid policy have brought China's growth to a standstill (by Chinese standards). Direct investment in the country has basically crashed and the political party is now whipped to speed up growth with various stimulus packages. Our simple assessment is that there is more upside than downside from here, but we take no active positioning based on that view. Within our portfolio LVMH is the company that benefits the most from increased economic activity in China.
Last but not least, there is activity in the French luxury and cosmetics sector. A new owner is on the way to Hermes! Nicolas Peuch, a childless 80-year-old heir to the Hermes empire, plans to adopt and then gift his 12 billion euro fortune to his 51-year-old gardener from Morocco. The Isocrates foundation that Peuch founded in 2011, which was supposed to promote good journalism among other things, opposes this, but seems to be advised to seek new sources of capital.
There was also news surrounding L'Oreal, where Francoise Bettencourt Meyers in December became the world's first woman to pass 100 billion euros in wealth. Her grandfather founded the company in 1909 and is undoubtedly one of Europe's most successful companies over many years. We recommend The Bettencourt Affair on Netflix.
If you, like Blackstone, are the world's largest asset manager with USD 1000 billion in assets under management, you a) have good self-confidence b) are self-deprecating and c) can spend time and resources to create the attached Christmas greeting
https://www.youtube.com/watch?v=CbqqAAgN-dIPORTFOLIO COMPANIES
Volution
In December, Volution released a financial update for the period August to November 2023. Organic growth was +3% compared to the previous year, which was better than the market expected. Three percent is a very strong figure given the company's high exposure to new construction and renovation. If Volution manages to grow in what is described as a very tough market – how fast can it grow when the economic situation normalises? The company also reported rising margins compared to the last accounting period. Strong price discipline, internal efficiency programs and a better product portfolio were cited as reasons.
Volution stock rose 19% in 2023 and remains one of the fund's largest holdings. We have great confidence in the company's management and appreciate the structural growth, the well-thought-out business model and, not least, the share's low valuation.
Rugvista
The Rugvista share rose 58% in 2023. It sounds like a high number, but you have to remember that the rate was very low at the beginning of the year. Today, the stock continues to trade significantly below its IPO price. The valuation remains low at around 10x EBIT for 2025 (our estimate). The company has made major improvements in a challenging environment and in the coming quarters we expect continued organic growth, mainly thanks to higher conversion rates. If we get our investment thesis right, the market should revalue the company upwards.
Accelleron
We rarely write about Accelleron. It is partly a function of the fact that the Swiss turbo engine company only reports figures every six months, and partly a function of the company's high degree of maturity: Accelleron is a stable player that should be able to grow organically by 2-5% per year with increased margins and strong cash flows. On top of this, there is an ambition to carry out acquisitions. A large proportion of sales come from the after-sales and are therefore defensive in nature. During the year, the share rose 37% in Swiss francs, or as much as 45% measured in euros, and was thus the fund's second best contributor in 2023.
SLP
The company carried out a rights issue on the last day of November, which affected the share price in the short term. This was regained with flying colors in December, when the share rose a whopping 17% and was thus the fund's second best contributor in December. Like other real estate companies, SLP will benefit from lower interest rates. If the company can grow the net operating income in line with its target of 15% and a return requirement that will gradually decrease, then we will see a huge result on the NAV. With strong cash levels and many investment opportunities, we are convinced that SLP is headed for a bright 2024. The stock rose 33% in 2023.
Corem
Corem became the fund's best share during the last month of the year with a rise of 20%. There have been no company-specific news that lifted the share. On the other hand, continued falling interest rates and, at least as important, that the main owner Rutger Arnhult bought a lot of shares. In addition to the usual positive signal value of insider buying, the effect here is double. The stock has for a long time been burdened by the fact that the main owner has been (or at least considered to be) under financial pressure. He probably isn't anymore, as the total purchase value for the businesses in December was around 850 million. On the other hand, there were two withdrawals from the letters of intent signed at the end of October. Financially, it was probably good for us as owners as they are in a completely different interest rate situation. Despite an increase of 34% in 2023, Corem is still traded at around a 50% discount to NAV.
Cargotec
Cargotec shares continued their journey upwards during December, closing the month at +14%. The subsidiary, MacGregor, continued to receive significant orders during the month and the valuation remains low. On our estimates, the EV/EBIT valuation is 7x on 2025 figures. As we previously wrote, there are several triggers in 2024 which will hopefully mean that the company continues to be valued by the market. Since we wrote two months ago that the valuation was so low that "it's almost hard to believe it's true", the share has rebounded around 50%. The stock rose 27% in 2023.
Bonesupport
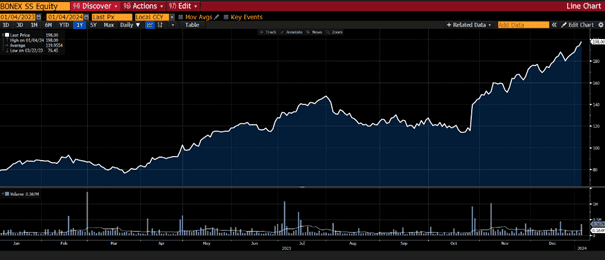
Bonesupport was once again a strong contributor to the fund in December, but it was also the fund's best stock in 2023. It was also the best performing stock on the Stockholm Stock Exchange last year. When we did our initial analysis and met with management, there was no doubt that the stock would be higher, the only question was how quickly the revaluation would happen. It is difficult to find anything to complain about in terms of the company's delivery over the past two years.
The launch of Cerament G in the US exceeded not only our expectations, but also the company's own. At our initial investment, our sales estimates for 2025 were more than 50% higher than consensus. Now the market has caught up and the share rose a whopping 134% in 2023. With a rising valuation, the burden of proof on the company increases, but we still believe that the market underestimates the company’s long-term potential. Without any vivid imagination, one can see the company's turnover of 5 billion within 10 years, which implies a turnover growth of 20% per year starting in one year. It does not feel aggressive given all the new markets that will be successively available and new indications. Given the above conditions, we still believe that Bonesupport will be a winner on the stock market, albeit at a more modest pace going forward. We present below a graph.
 Source:Bloomberg
SUMMARY
Another intense year is now behind us. We experienced a short but intense American banking crisis in March. A China that opened up after the pandemic, but whose economy did not recover. For the first time in over 20 years, returns were negative on the Chinese stock market for three consecutive years.
In Europe, Greece (+44%) was the best stock market after Italy (+32%), where Greece has shown the strongest GDP growth in Europe in the last two years. Who would have thought? In the US, the housing developers were the real winning sector with 82% in return. In Europe, the best sectors were retail, construction-related companies and technology. Probably also surprising to most.
Geopolitically, the curtain was firmly closed with Russia's brutal assault on Ukraine and October 7th, unfortunately, will forever be associated with Hamas's horrific act of terror against Israel.
The starting position, a year ago, was inflation which was around the highest levels in several decades. Interest rates skyrocketed and in Europe the energy crisis was a reality. In the US, the Nasdaq had just finished 2022 with -33% and investors were more or less wounded.
12 months later, it can be stated that the outcome for 2023 was significantly better. Below are a number of well-known strategists' target price for the S&P500 at the end of 2022. Everyone was too cautious as the outcome was a whopping 18% better than the average forecast.
 Source: @CharlieBilello
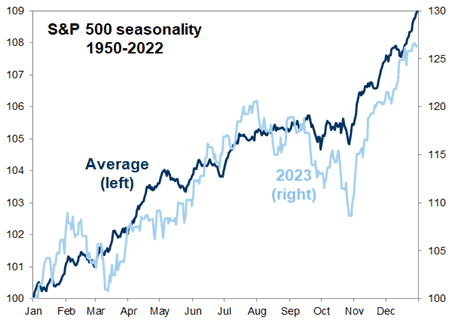
The year ended as usual. We have had the below picture here for the last two months and it was an exceptionally good time to increase the risk at the end of October. Something we did and one of the reasons for our strong end to the year.
 Source: Goldman Sachs
For about two years, the market has been waiting for an American recession, which still hasn't happened. The most anticipated recession ever? 44% expected a US recession a year ago. The corresponding estimate today is around 50%, but will likely (in our view) drop in the coming months. The US economy has once again surprised in an impressive way to say the least. Here and now, it can be stated that the market was once again absolutely right.
 Source: Goldman Sachs
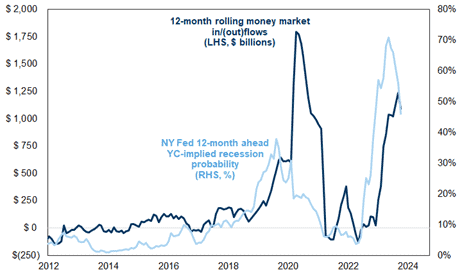
The cautious view of the economy has led to huge inflows into money market funds.
 Source: Goldman Sachs
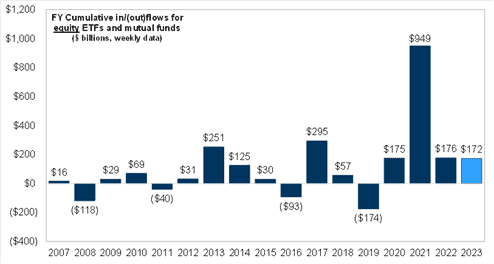
The inflow into equity funds has been considerably less despite a strong development last year. The lowest in four years.
 Source: Goldman Sachs
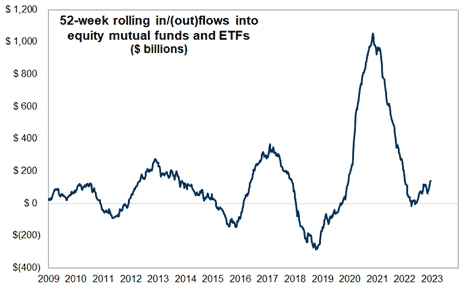
That should mean investors still have plenty of capital left to put to work when the time is right. The last time when inflows to money market funds sharply reversed was 2009, which was a very strong year for the world's equity markets. It was followed by more outflows in 2010 and 2011. The probability that we will see corresponding outflows in 2024 flowing into the equity markets feels high. Despite a strong last quarter in 2023, one can hardly discern any change in the pace of deposits, see the image below.
 Source: Goldman Sachs
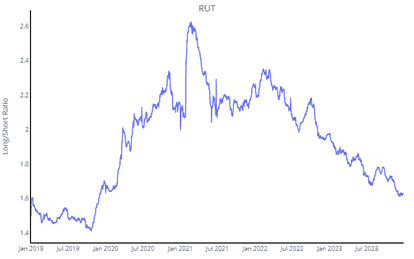
In addition to available capital as stated above, the image below is also interesting for understanding the starting position. It shows the exposure of Goldman Sachs clients to smaller companies, and it is clear that it is very low. Despite a strong end to the year, our assessment is that a large part of available capital is outside or has low exposure to this asset class. Historically, smaller companies have always had a strong development when inflation and interest rates fall.
 Source: Goldman Sachs
So after updating capital flow and positioning, what does the valuation look like? The image below shows the difference in valuation between the American and European stock markets. Barely P/E 13x for 2024 in Europe hardly feels challenging and is clearly below the historical average level.
 Source: Kepler Cheuvreux
The difference in valuation between the American and European stock markets is at a record level and increased further last year, mainly because Europe does not have any defined AI companies. That there is a very large difference even after removing technology and other sectors is easy to see when BP and Shell are traded at P/E 7x 2024e while Exxon and Chevron are traded at 11x.
 Source: Kepler Cheuvreux
The biggest explanation for the valuation difference between the US and Europe is profit growth, see below.
 Source: Kepler Cheuvreux
The valuation of European small caps rose slightly at the end of last year (P/E 12.7x), but remains below the historical average and should rise 30% to reach pre-Covid levels.
 Source: Kepler Cheuvreux
The European small companies have not been valued so low in relation to the larger companies in 20 years.
 Source: Kepler Cheuvreux
So the starting point for the new year is as follows:
• The odds for a reversal of flow from money market funds to equity funds during the year are considered good.
• The positioning in small companies as an asset class is low.
• European companies are trading at a record discount relative to American ones.
• European small caps are trading relative to larger companies at their lowest level in 20 years.
Conclusion: The starting position looks attractive.
We take the liberty of copying one of last year's best images which we featured in our letter two months ago. How have smaller companies developed in different inflation scenarios? Historically very good and we are now experiencing a historic decline in inflation. We have endured 22 months of rising inflation and now know what that meant and we got a taste of the opposite in November and December.
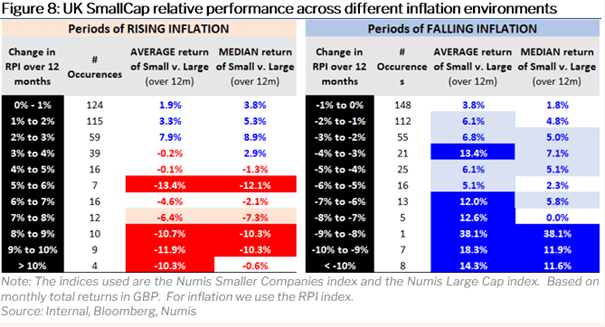 Source: Bloomberg, Numis
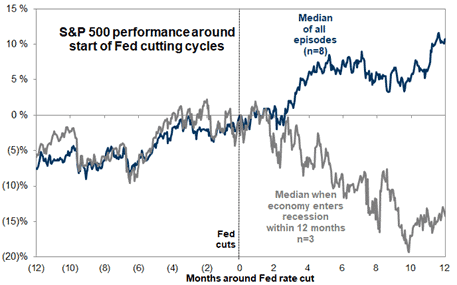
How has the S&P500 performed as the Fed begins to cut interest rates. It depends very much on whether there will be a recession or not. Our basic view remains positive, insofar as we do not expect any deeper recession in the economy.
 Source: Goldman Sachs
Below is an overview of the valuation and beta of the various European markets. Denmark stands out because of Novo Nordisk's weight in the index.
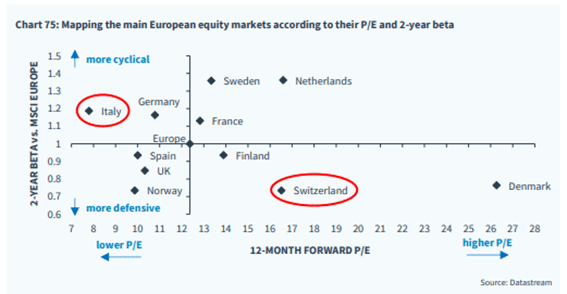 Source: Kepler Cheuvreux
The new year has started on a weak note but as we have just completed nine positive weeks in a row, you probably shouldn't rush to conclusion after only two trading days. We had to wait for over a year until we got a new high on the leading exchanges. In the United States, it has happened 14 times since 1954, and after such an event there has often been a tepid development in the short term, but after a year the median return has been just over 13%(13 out of 14 occasions).
Geopolitically, it looks worrying and the risks are probably greater today than in any other post-war year. According to themselves, Israel is now under attack from seven different directions: Gaza, the West Bank, Lebanon, Syria, Iraq, Yemen and Iran. The common denominator and major sponsor is Iran. Putin's barbarism continues and we hope and believe that the West will continue to pump resources into Ukraine. In addition, it is a super election year when half of the world's population goes to the polls. The election in the USA in the autumn will of course be the most interesting.
Our conclusion is, all in all, and despite the geopolitics, that we are likely facing a decent stock market year. This applies above all in the areas of stock picking and small and medium-sized companies, our core business. The image below shows the relative valuation for small and medium-sized companies that continue to trade at, historically, very low levels.
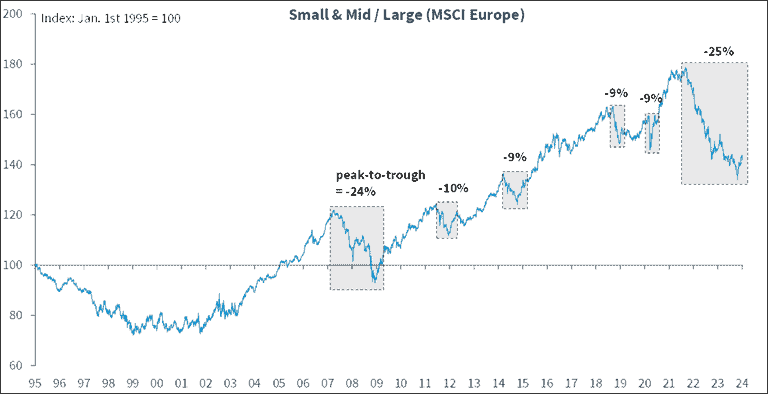 Source: Kepler Cheuvreux
We don't expect a recession, at least not a deeper one, and then the P/E of 13x for the European stock market is cheap. Falling interest rates and inflation will make people happier, not least in Sweden, and economic activity may start to pick up in a few quarters.
We are thankful and appreciate the interest shown and for all the support during the last year. Onwards and upwards!
Mikael & Co
Malmö January 8th, 2024
[/et_pb_text][et_pb_post_title _builder_version="3.0.89" title="on" meta="off" author="off" date="off" categories="off" comments="off" featured_image="off" featured_placement="below" text_color="dark" text_background="off" border_style="solid" module_class="gen-single-news-heading-module gen-trustee-single-headline" date_format="d M, Y" border_style_all="solid" disabled_on="on|on|on" disabled="on" /][et_pb_text admin_label="Coeli Nordic Corporate Bond Fund R-SEK" _builder_version="3.0.89" background_layout="light" module_class="gen-table-module" disabled_on="on|on|on" disabled="on"]
Coeli Nordic Corporate Bond Fund
| Performance in Share Class Currency | 1 Mth | YTD | 3 yrs | Since incep |
| Coeli Nordic Corporate Bond Fund - R SEK | 1.30% | -0.93% | 3.38% | 14.52% |
| | | | |
[/et_pb_text][et_pb_text admin_label="Coeli Nordic Corporate Bond Fund R-SEK" _builder_version="3.0.89" background_layout="light" module_class="gen-table-module" disabled_on="on|on|on" disabled="on"]
[cg_linear_graph id="31122"]
[/et_pb_text][et_pb_image _builder_version="3.0.89" src="https://coeli.com/wp-content/uploads//2020/10/ncbr.png" show_in_lightbox="off" url_new_window="off" use_overlay="off" always_center_on_mobile="on" force_fullwidth="off" show_bottom_space="on" disabled_on="on|on|on" disabled="on" /][et_pb_image _builder_version="3.0.89" src="https://coeli.com/wp-content/uploads/2019/01/Gustav-Fransson6.jpg" show_in_lightbox="off" url_new_window="off" use_overlay="off" always_center_on_mobile="on" force_fullwidth="off" show_bottom_space="on" custom_margin="||21px|" disabled_on="on|on|on" disabled="on" /][et_pb_text admin_label="Namn och title" _builder_version="3.0.89" background_layout="light" module_class="gen-single-ingress-module" custom_margin="||40px|" disabled_on="on|on|on" disabled="on"]
Gustav Fransson
Portfolio Manager of Coeli Nordic Corporate Bond Fund
[/et_pb_text][et_pb_image _builder_version="3.0.89" src="https://coeli.com/wp-content/uploads/2018/10/Alexander-Larsson-Vahlman.jpg" show_in_lightbox="off" url_new_window="off" use_overlay="off" always_center_on_mobile="on" force_fullwidth="off" show_bottom_space="on" custom_margin="||21px|" disabled_on="on|on|on" disabled="on" /][et_pb_text admin_label="Namn och title" _builder_version="3.0.89" background_layout="light" module_class="gen-single-ingress-module" custom_margin="||40px|" disabled_on="on|on|on" disabled="on"]
Alexander Wahlman
Senior Analyst
[/et_pb_text][et_pb_text admin_label="Top Holdings (%)" _builder_version="3.0.89" background_layout="light" custom_margin="||20px|" module_class="gen-trustee-single-table" disabled_on="on|on|on" disabled="on"]
Top Holdings (%)
| LANSBK 1.25% 18-17.09.25 | 4.1% |
| NORDEA HYP 1.0% 19-17.09.25 | 4.1% |
| SWEDBK 1.0% 19-18.06.25 | 4.1% |
| WHITE MOUNT FRN 17-22.09.47 | 3.9% |
| B2 HOLDING FRN 19-28.05.24 | 2.9% |
[/et_pb_text][/et_pb_column][/et_pb_row][et_pb_row _builder_version="3.0.89" background_position="top_left" background_repeat="repeat" background_size="initial" module_class="gen-single-news-content-row gen-trustee-single-content-row" custom_padding="0px|||" custom_padding_phone="23px|||" custom_padding_last_edited="on|tablet" module_class_2="gen-trustee-single-sidebar" disabled_on="on|on|on" disabled="on"][et_pb_column type="2_3"][et_pb_text admin_label="Tillbaka-knapp" _builder_version="3.0.89" background_layout="light" border_style="solid" custom_margin_tablet="||17px|" custom_margin_last_edited="on|desktop" module_class="gen-back-button hide-in-print" border_style_all="solid"]
Note that the information below describes the share class (I SEK), which is a share class reserved for institutional investors. Investments in other share classes generally have other conditions regarding, among other things, fees, which affects the share class' return. The information below regarding returns therefore differs from the returns in other share classes.
Return to Fund page
[/et_pb_text][et_pb_text admin_label="Datum / Skriv ut" _builder_version="3.0.89" background_layout="light" border_style="solid" custom_margin_tablet="||17px|" custom_margin_last_edited="on|desktop" module_class="gen-single-news-date-module gen-trustee-print-module hide-in-print" locked="on" border_style_all="solid"]
[blog_post_date]
Print
[/et_pb_text][et_pb_post_title _builder_version="3.0.89" title="on" meta="off" author="off" date="off" categories="off" comments="off" featured_image="off" featured_placement="below" text_color="dark" text_background="off" border_style="solid" module_class="gen-single-news-heading-module gen-trustee-single-headline" date_format="d M, Y" border_style_all="solid" /][et_pb_text _builder_version="3.0.89" background_layout="light"]
Utveckling september
Fondens värde sjönk -5,1 procent i september (andelsklass I SEK). Stoxx600 (brett Europaindex) sjönk under samma period med -3,4 procent och HedgeNordics NHX Equities var preliminärt oförändrat. Motsvarande siffror för 2021 är en ökning om +21,6 procent för fonden, +14,0 procent för Stoxx600 och +6,4 procent för NHX Equities.


Equity markets / Macro environment
After seven consecutive months of positive performance the world’s stock markets were poised for some degree of turbulence. Volatility was especially high in some equities and on Monday, September 20, the highest nominal volume ever traded was reached in options on the S&P500 (!) The broad European index fell by 3.4 percent in September compared to the S&P500 which fell by 4.8 percent. The fund also had its first negative performance since October last year with a decline of 5,1 percent. More about that later.
Despite high levels for many stock indices, sentiment among investors has been relatively gloomy. Bank of America's monthly survey recently showed that only 13 percent of managers expect a positive market in the future, which is the lowest figure since April 2020 (and that was clearly wrong). The reasons cited are China's growth problems, the crisis-stricken Chinese real estate giant Evergrande, the development of the delta variant, declining profit growth and, of course, rising inflation. However, they are still overweight equities which is perhaps not so strange when you have to pay to lend your capital to countries. As interest rates rose at the end of the month, the German 10-year interest rate followed with a giant step from - 0.25 percent to - 0.17 percent… The picture below is an overall risk indicator, and we are around zero (neutral).

The news flow in September began with record high inflation figures in Europe at +3.0 which exceeded market expectations. The corresponding figure in July was + 2.2 percent. It was the fastest growth rate since November 2011 and several countries recorded up to five percent in inflation rate. The pressure on the ECB to reduce its support measures is increasing. On Friday, October 1, new inflation figures came in for September, which showed a further acceleration in the inflation rate by +3.4 per cent.
The rate of change can be mostly attributed to rising energy prices that are starting to create real problems in the world's economies as well as agricultural shifts. The picture below shows that food prices are at record high levels over the past 60 years. The biggest losers are the poorest part of the population.

In the slightly longer term it is forecasted that it is not excessive demand that will drive inflation, but rather a limited supply, and then both in terms of products and labour. At the end of September, long queues were reported at petrol stations across the UK when fuel ran out and there were not enough truck drivers to refuel. Prime Minister Boris Johnson urges his citizens to refuel sensibly and at a normal rate. You wanted Brexit, so there you go. In sheer desperation, Johnson has now issued 5,000 temporary short-term visas for temporary drivers. Good luck.
M25 spring 2022?

Below are European gas prices which have risen in a seemingly uncontrolled fashion and recorded the highest September prices ever. A silent prayer for the mild winter. We guess that this development will soon be a major topic in the media, and it will undoubtedly create various problems and somewhat reduce next year's expected growth. It feels reassuring that Per Bolund (Swedish Green Party MP) claims that there is no electricity shortage in Sweden because then the costs for ordinary people would be unbearably high during the winter (which of course they will be). Rising gas and electricity prices have led European politicians to start discussing billion-dollar subsidies (in euros) to households and manufacturers who will experience sharply rising electricity bills over the winter.

Source: Bloomberg
Henrik Svensson, site manager at the oil-fired power plant in Karlshamn (south Sweden), does not agree with Per Bolund that we have a surplus of electricity in the country. For large parts of September, the power plant ran at full capacity and burned 240k liters of oil per hour. Henrik Svensson believes that it is electricity shortages and high electricity prices that are behind the high production. He also says that there is a lack of planned power production in southern Sweden and that it will take many years before the electricity grid is strengthened and new electricity production is in place. Sweden today burns more oil than we have done in 10 years. A gigantic energy policy and climate policy failure signed by the Green Party.

Source: Steget efter
Winning candidate for this year's Christmas presents below.

The change in the US 10-year interest rate created considerable pressure on, primarily, growth stocks at the end of the month. The performance dispersion for different sectors was very large in September with oil shares as a clear winner. This was also felt in the last days of September.

Source: Bloomberg
Below is the development for the US 10-year interest rate. The turbulence in the stock market was caused by the change in interest rate level breaking through on the upside, as can be seen in the chart.

There have been countless attempts to explain the turbulence in recent weeks. The recent and significant amount of options being exercised, Evergrande, interventions by the Chinese government, Fed tapering, Bank of England expected to raise interest rates, delta variant, inflation, bottlenecks in production, difficulties in finding staff, rising energy prices and declining growth rates. We think it is enough to look at the picture below. Rising interest rates hit hard at growth companies' valuations.

Goodbye Mutti and thank you for an extraordinary effort for Europe!

Source: Nyhetsbyrån TT
She was politically in a class of her own during the euro crisis ten years ago and Sweden also has her to thank for a lot. Despite a somewhat weaker performance in recent years, German citizens have experienced significantly better economic development than many others.

On September 29, the covid-19 restrictions in Sweden were finally removed and we can now, in principle, start living a normal life again. The number of bookings for winter holidays skyrocketed to the great joy of the tourist and transport industry. In recent months, tourism activity in the Mediterranean has been "extraordinary" and much better than forecasted before the summer. Luxury travel is also reaching new heights. Private jet passengers to Mallorca increased by +70 percent in July compared to July 2019 with an average of 83 private jets per day landing in Palma. If you want to rent a yacht, you are being referred to next year as basically everything has already been fully booked.
We now belong to a minority group. Passively managed capital exceeds actively managed capital for the first time ever. This will give us more opportunities as mispricing increases.

In addition to being one of the world's best stock markets this year, Sweden also has the most listed companies in the entire EU. Bloomberg drew attention to the fact that there are now around 1,000 listed companies on the various trading platforms in Stockholm. More than 80 percent are smaller companies, and the list is filled with new listings every day until Christmas! For us, it is interesting as we are constantly looking for new potential core holdings. In recent weeks, we have identified one which we write about under Long Positions.
We end this section with a picture that well reflects today's political level.

Source: Kluddniklas
Long positions
Truecaller
During September, we did a lot of work on the Swedish company Truecaller which will go public on October 8th. Truecaller is one of the most interesting companies we’ve seen in recent years. Truecaller has developed a phone application that can, among other things, identify unwanted calls from, for example, telemarketers. The app is one of the top ten most downloaded applications globally, and in some of the main markets such as India, Nigeria and Indonesia, it is one of the three most downloaded apps. As a Swedish company with headquarters in Stockholm, the firm has chosen to list on the Swedish stock exchange, which we are very happy about.
Truecaller was founded in 2009 by Alan Mamedi and Nami Zarringhalam. They met at the Royal Technical University in Stockholm, and they continue to be active in the company as the CEO and Chief Strategic Officer (CSO), respectively. When they released the first version of the app, they received 10,000 downloads within one week. By 2013 they had reached over 10 million users globally and in Q2 2021 they had reached 278 million monthly users. Throughout their journey, Truecaller has attracted several well-known investors such as Sequoia Capital (early investors in Apple, Whatsapp, and Zoom among others), Atomica (Skype-founder Niklas Zennström’s investment company), and Kleiner Perkins (early investors in Google, Amazon, and Spotify among others).

Until recently, revenue streams have mainly consisted of income from in-app advertising. In addition to this, there is a premium version where paying users can get additional functionalities. That business accounted for around 20 percent of revenues in 2020. During the fall of 2020, Truecaller launched a corresponding offering that targets corporates. This part of the business allows B2B customers to be listed as verified callers when they call private people. It can for example be a security company that calls about an alarm or a courier company that needs to get in contact with a receiving customer. It is a common problem that these types of companies get rejected when the call-receiver doesn’t recognize the number.
Truecaller declares that their product benefits from network effects. i.e., the product gets better the more people who use it (think Facebook). This can be relatively easy to appreciate since phone number identification inherently evolves from reporting of unwanted calls by the users, i.e., when enough people have reported an unwanted call Truecaller flags for this in the app). Over time, Truecaller has built a database containing 5.7 billion unique phone-identities. Network effects doesn’t just build a better product over time, they also increase the entry-barriers for potential competition.
The majority of Truecaller’s income comes from developing countries. The company explains that the problems related to spam emails, harassment, unwanted calls, and messages are more common there than in the western world. India is Truecaller’s largest market where these types of problems are significant. One positive aspect of the geographical exposure is that it allows for a nice structural tailwind: the population growth in developed markets is much higher than in the west (driven by an increasing average age) and the smartphone penetration is growing fast.
Historically, 97 percent of all app downloads have been organic. However, management has begun to experiment with user acquisitions by the way of advertisements through, for example, Facebook. The returns on user acquisition looks extremely attractive. In some markets, such as India, Truecaller could achieve a return on investment of up to 20x on every spent dollar. In more mature markets, such as the USA, the same multiple amounts to 4x, still very attractive. Indonesia, which is a relatively new market to the company, has a multiple of 0.8x. This means any user acquisition spend in Indonesia is unprofitable at this point. However, management is confident that the return profile will wander above the 1x as more users join and the network effects take place. In summary, the investment opportunities are plentiful and attractive – and unique.
In summary, several things speak for significant growth in the future. The investment in paid user acquisition, a sharpened premium-offer, the newly launched B2B product and continued growth of the advertising business. In addition to this, acquisitions may likely follow.
Growth has been prioritized over profitability and it is only recently that the company began to report profits. In 2019 sales grew by 57 percent. In 2020 the corresponding figure was 64 percent, and during the first half of 2021 the company’s sales grew with as much as 151 percent in comparison to the same period last year (which was partly affected by the pandemic). During the first half of this year, the company’s operating margin was 32 percent. As you can imagine, Truecaller is very capital-efficient. Working capital is very low which gives a nice cash conversion and a very high return on capital employed – all attributes that are required to create a very successful and valuable company over time.
Truecaller targets a revenue growth of at least 45 percent between 2021-2024e. After 2024 the EBITDA-margin should be at least 35 percent. The sum of the year-on-year growth and the EBITDA-margin should amount to at least 70 percent (a variant of the rule of 40 that tries to balance growth and profitability). We don’t think it will be difficult to reach these targets and the analyst estimates we have looked at are cautious, especially regarding profitability. In our preliminary prognosis for 2023, our EBITDA-estimate is around 16 percent ahead of the analyst estimates that we’ve studied. This is based on that Truecaller can continue to grow sales much faster than hiring new people while the gross margin improves slightly in coming years.
The gross margin is an interesting aspect of the equity story. Truecaller’s gross margin amounts to approximately 70 percent. Most of the cost of sales consists of platform fees to Apple and Google. Since Apple and Google practically control the distribution channels for apps together, a duopoly has occurred and prices for app-developers such as Truecaller have remained high around 25-30 percent of sales. This situation is now heavily criticized from all parts of the world since the situation is not considered competitive, for example
look at this analysis about an American court ruling concerning a twist between Epic Games and Apple. We believe Google and Apple’s fees will decrease over time – which would be a positive event for Truecaller. Furthermore, Truecaller’s new business deal bypasses Goggle and Apple, which gives a gross margin of close to 100 percent. This will strengthen the profitability even more.
There are of course risks associated with the dependence on Google/Apple (which is the case for every company in the application business); the geographical exposure and one should never write off the threat of competition even if it seems far away at this stage. However, we do believe the benefits outweighs the negatives. Truecaller has excellent financial characteristics, operational founders with large shareholdings who will remain active in the business and some of the world’s most well-known investors behind it. We therefore look forward to being included as an anchor investor ahead of the stock exchange listing on October 8th. We are even more excited to follow the company’s successes in current and new markets in the coming years.
CVS Group
One of the happiest days of the month was when our veterinarian company CVS Group released their interim numbers. Once again, the company beat analysts’ expectations which have been raised several times over the course of the year. In the first two months of the new financial year (which begins in July), the company has grown by 17 percent. This can be compared with the growth expectations for the full year which, before the report release, were 7 percent. Once again, analysts have thus far been “forced” to upgrade their assumptions. In a sour September stock market, the share fell 3 percent.
It becomes clear that the positive effect of the pandemic on pet ownership is more tenacious than ever. Pets live for many years, and we believe many underestimated the importance of the large number of new customers during the pandemic. Below is a graph of Google searches for veterinarians in the UK as well as data from the Swedish Board of Agriculture regarding the number of newly registered dogs. We speculate that the UK has similar trends as Sweden. The data points are also positive for our other pet company Swedencare. Pet companies are obviously still hot; right now there’s a bidding war going on over the German pet company Zooplus, where EQT is currently in the lead with the highest bid. We also note that there have been several venture capital-led acquisitions of veterinary companies at higher multiples than CVS is valued at.

Source: Jordbruksverket, Coeli

Source: Google Trends, Coeli
Lindab
Since our first investments in Lindab in the autumn of 2019, the thesis has always been that the building systems business segment did not fit into the business and in September, management finally found a buyer for the company. The transaction entails a write-down of goodwill corresponding to SEK 430 million, but it is cash flow neutral. Lindab took the opportunity to update its financial targets; the company now wants to grow by 10 percent per year (of which approximately two thirds are through acquisitions) and reach an operating margin of at least 10 percent (previously 10 percent over a business cycle). The share responded positively to the message.
We noted broad insider purchases in Lindab during the month, also from CEO Ola Ringdahl himself, which we think bodes well for the report in October. Despite this the share price decreased 8 percent in September.
Victoria
We have written several times about the British flooring company Victoria, which in September had a weak share price development of 17 percent. By all accounts, the company is doing well – during the month it was reported that sales rose 70 percent compared to 2020, and 50 percent compared to 2019. If you only partially extrapolate these figures for the rest of the year, it is obvious that analysts’ expectations are too low. We believe that this month’s decline is related to flows: growth companies and small and mid-cap companies were some of the most affected sectors in September – Victoria was hit from both sides. We have increased our position in recent days.
The Pebble Group
One of the month’s (few) joys was Pebble Group. As we previously wrote, the company is active in the market for gift advertising, i.e. gifts that companies give to customers, employees, and other stakeholders for marketing purposes. In September the company came out with its half-year figures that were better than expected. Pebble’s software division, Facilisgroup, is growing better than our expectations. This is also the part we believe the market is valuing too low. The stock rose 10 percent in September.
Knaus Tabbert
During the last trading day in September, our German motorhome manufacturer Knaus Tabbert announced that the forecasts for 2021 must be lowered due to component shortages. We are not particularly surprised that this has happened given what we have seen from other vehicle manufacturers. If the company can remedy these supplier problems, management believes that 2022 will be unaffected at best, as Knaus still has a bursting order book, increased production capacity and more suppliers from January next year. The share fell 7 percent in September.
Short positions
The short portfolio contributed with a negative result during the month. Our short-term negative positions in the German DAX had the largest negative contribution. Some stock specific short positions that contributed positively to the result were Swedish Dometic, German Henkel and Norwegian NEL.
Exposure
The net exposure, adjusted for our unlisted holdings, at the beginning and end of the month was 76 and 74 percent, respectively.
Summary
September's negative return of x percent also meant the end of the fund's, so far, longest period of positive return (10 months). We are obviously disappointed with that, but we have been in the game long enough to understand that equities sometimes must fall to be able to refuel and continue their upward trajectory. In general, September was the weakest month for many equities since the crisis started 1.5 years ago. September, otherwise, started strong for us and was a continuation of an unusually good performance at the end of August. Our companies presented many good news (except for Knaus Tabbert on the last day of the month) but small-caps and especially those categorized as growth shares, had a very weak performance during September. The main reason for this was, as previously mentioned, the change in the US long-term interest rate and general "risk off".
The picture below shows the development since March last year compared with the corresponding time intervals in the financial crisis in 2009 and onwards. Both periods have shown an unusually strong recovery and the current trend is even stronger than when the financial crisis raged 12 years ago.

Source: Goldman Sachs
Since the crisis started 1.5 years ago, we have had three different phases. The first and shortest, "despair", showed a decline in prices of 33 percent. The second phase, "hope", ended at the beginning of this year and showed a very strong return of 79 percent despite declining earnings. The last, “growth”, where we are now, has shown +11 percent in share prices with sharply rising growth for companies' earnings, but at lower valuations.

Source: Goldman Sachs
The recovery for American companies (below) has been extremely strong and compared to 2019, the 2021 profits will be approximately 36 percent higher. Very impressive.

Source: Goldman Sachs
It is very gratifying that Europe, for once, is keeping up with the United States and showing strong profit growth. Compare this with the non-existent profit growth between 2007–2019 (!)

Despite rising equity prices, valuations have fallen and Europe is now trading around 16x the profit 12 months ahead. It's not very strenuous (we think). For an average commercial property, you can get a return of maybe 3 percent before net financial costs. After financing, this corresponds to at least P/E 50x. And paying to lend to different countries does not feel like an exciting alternative either.

Source: Goldman Sachs
The valuation of global shares in relation to global GDP looks more strained. A major reason for this is the central banks' aggressive policy.

The valuation of the major leading technology companies is at an average level seen from the last five years.

Source: Goldman Sachs
The image below is striking. It shows that Swedish property prices, which have risen by almost 200 percent over the past 15 years, have had the same development as the money supply. In theory, price per m2 and krona is unchanged for the past 15 years. Is there anyone who still doubts that the world's central banks are responsible for the largest wealth creation in human history? It is important to be on the wagon because when it is gone you’ve missed it. And what central banks cannot push, the price of bitcoin for example, rises even more as central banks cannot make more of it. The opportunities for central banks to reverse the band are few. In the long run, this means that the next 10 years will, overall, be a good period for, for example, stock picking. All forms of uniqueness (growth) will be highly valued to compensate for the fact that the value of money decreases at a rapid pace.

If there is anyone who is still not convinced, take a look at the picture below. The market capitalization of the S&P500 divided by the Fed's balance sheet….

Source: Bloomberg
Onwards and upwards. The wealth of American households is accelerating away from the change in GDP.

Thank you Fed and all the world central banks!

Citigroup's surprise index has weighed down and analysts' profit estimates are also starting to soften. Not a good combination and it has undoubtedly contributed to the weak development in the stock markets recently.

It took a full 219 days for the S&P500 to have a decline of 5 percent. We will see how high the next bar will be.

Timing is everything. A fascinating graph that shows the importance of having reasonable timing in decisions.

Source: Goldman Sachs
Despite a difficult month behind us, it feels reasonable to expect a stronger market during the last quarter of the year. Our view is that we are still in a rising market, although we are likely to experience some turbulence for a few more weeks. "Bear markets" are constantly declining with sharp rallies while "bull markets" continue to rise with some strong drawdowns. We therefore believe that we are still in a rising market.
Some statistics to cheer you up. The S&P500 managed to rise by 0.2 percent in the third quarter (Europe -1.9 percent) which means six consecutive positive quarters. This has only happened eight times before and only on one of the (eight) occasions has the following quarter yielded a negative return. Two quarters later, it has in all cases yielded a positive return. In addition, for the past 20 years, October has been the fourth best month, thus much better than its reputation. Having pointed that out, October takes first place in terms of most frequent daily movements that exceed one percent.
The Stockholm Stock Exchange, which is an excellent reference point, had risen by 30 percent at its highest about a month ago, but is currently at 20 percent. Even more important is that measured in USD, OMX has "only" risen by 13 percent, which is in line with the US stock markets. This is hardly excessive given the profit growth among the companies. The risk premium in the market is high.
Investors are reasonably careless, and we are approaching the turn of the year. Global growth is well above average and interest rates are extremely low. Given how cruel the market has been to many investors this year, with sector rotations and a high concentration of companies driving performance, it almost feels obvious that the broad mass of investors will continue to reduce risk in their portfolios and then be short equities at year-end when the market rises. We'll see, but that's our main scenario right now.

We are now closing the books for the third quarter, and we look forward to the end of the year and above all the entrance for Truecaller on the Stockholm Stock Exchange on October 8!
Thank you for this month and we'll hear from you later.
Mikael & Team
Malmö on 5 October
[/et_pb_text][et_pb_text admin_label="Coeli Nordic Corporate Bond Fund R-SEK" _builder_version="3.0.89" background_layout="light" module_class="gen-table-module" disabled_on="on|on|on" disabled="on"]
Coeli Nordic Corporate Bond Fund
| Performance in Share Class Currency | 1 Mth | YTD | 3 yrs | Since incep |
| Coeli Nordic Corporate Bond Fund - R SEK | 1.30% | -0.93% | 3.38% | 14.52% |
| | | | |
[/et_pb_text][et_pb_text admin_label="Coeli Nordic Corporate Bond Fund R-SEK" _builder_version="3.0.89" background_layout="light" module_class="gen-table-module" disabled_on="on|on|on" disabled="on"]
[cg_linear_graph id="31122"]
[/et_pb_text][et_pb_image _builder_version="3.0.89" src="https://coeli.com/wp-content/uploads//2020/10/ncbr.png" show_in_lightbox="off" url_new_window="off" use_overlay="off" always_center_on_mobile="on" force_fullwidth="off" show_bottom_space="on" disabled_on="on|on|on" disabled="on" /][/et_pb_column][et_pb_column type="1_3"][et_pb_image _builder_version="3.0.89" src="https://coeli.com/wp-content/uploads/2019/01/Gustav-Fransson6.jpg" show_in_lightbox="off" url_new_window="off" use_overlay="off" always_center_on_mobile="on" force_fullwidth="off" show_bottom_space="on" custom_margin="||21px|" disabled_on="on|on|on" disabled="on" /][et_pb_text admin_label="Namn och title" _builder_version="3.0.89" background_layout="light" module_class="gen-single-ingress-module" custom_margin="||40px|" disabled_on="on|on|on" disabled="on"]
Gustav Fransson
Portfolio Manager of Coeli Nordic Corporate Bond Fund
[/et_pb_text][et_pb_image _builder_version="3.0.89" src="https://coeli.com/wp-content/uploads/2018/10/Alexander-Larsson-Vahlman.jpg" show_in_lightbox="off" url_new_window="off" use_overlay="off" always_center_on_mobile="on" force_fullwidth="off" show_bottom_space="on" custom_margin="||21px|" disabled_on="on|on|on" disabled="on" /][et_pb_text admin_label="Namn och title" _builder_version="3.0.89" background_layout="light" module_class="gen-single-ingress-module" custom_margin="||40px|" disabled_on="on|on|on" disabled="on"]
Alexander Wahlman
Senior Analyst
[/et_pb_text][et_pb_text admin_label="Fund Overview" _builder_version="3.0.89" background_layout="light" custom_margin="||20px|" module_class="gen-trustee-single-table"]
Fund Overview
| Inception Date | 2017-12-20 |
| Investment management fee (share class I SEK) | 1.00% p.a + 20% Performance fee (OMRX T-Bill Index) |
| Performance Fee. Yes | 20% |
| Risk category | 5 of 7 |
[/et_pb_text][et_pb_text admin_label="Top Holdings (%)" _builder_version="3.0.89" background_layout="light" custom_margin="||20px|" module_class="gen-trustee-single-table" disabled_on="on|on|on" disabled="on"]
Top Holdings (%)
| LANSBK 1.25% 18-17.09.25 | 4.1% |
| NORDEA HYP 1.0% 19-17.09.25 | 4.1% |
| SWEDBK 1.0% 19-18.06.25 | 4.1% |
| WHITE MOUNT FRN 17-22.09.47 | 3.9% |
| B2 HOLDING FRN 19-28.05.24 | 2.9% |
[/et_pb_text][/et_pb_column][/et_pb_row][/et_pb_section][et_pb_section bb_built="1" fullwidth="off" specialty="off" _builder_version="3.0.89" module_class="gen-trustee-single-yield-section gen-pattern-section" custom_padding="0px|||"][et_pb_row _builder_version="3.0.89" custom_padding="||53px|"][et_pb_column type="4_4"][et_pb_text admin_label="VIKTIG INFORMATION" _builder_version="3.0.89" background_layout="light" module_class="gen-trustee-single-warning-blurb"]
IMPORTANT INFORMATION. This is a marketing communication.
Before making any final investment decisions, please refer to the prospectus of Coeli SICAV II, its Annual Report, and the KID of the relevant Sub-Fund. Relevant information documents are available in English at coeli.com. A summary of investor rights will be available at
https://coeli.com/regulatory-information-coeli-asset-management-ab/.
Past performance is not a guarantee of future returns. The price of the investment may go up or down and an investor may not get back the amount originally invested.
[/et_pb_text][/et_pb_column][/et_pb_row][/et_pb_section]