[et_pb_section bb_built="1" fullwidth="off" specialty="off" _builder_version="3.0.89" background_image="https://coeli.com/wp-content/uploads//2018/08/malmo-bro-comp.jpg" parallax="on" module_class="gen-trustee-single-hero"][et_pb_row][et_pb_column type="4_4"][/et_pb_column][/et_pb_row][/et_pb_section][et_pb_section bb_built="1" fullwidth="off" specialty="off" _builder_version="3.0.89" custom_padding="0px||0px|"][et_pb_row][et_pb_column type="4_4"][/et_pb_column][/et_pb_row][et_pb_row _builder_version="3.0.89" background_position="top_left" background_repeat="repeat" background_size="initial" custom_padding="0px|||" custom_padding_phone="23px|||" custom_padding_last_edited="on|tablet" module_class_2="gen-trustee-single-sidebar" module_class="gen-single-news-content-row "][et_pb_column type="4_4"][et_pb_text admin_label="Tillbaka-knapp" _builder_version="3.0.89" background_layout="light" border_style="solid" custom_margin_tablet="||17px|" custom_margin_last_edited="on|desktop" module_class="gen-back-button hide-in-print" border_style_all="solid"]
Note that the information below describes the share class (I SEK), which is a share class reserved for institutional investors. Investments in other share classes generally have other conditions regarding, among other things, fees, which affects the share class' return. The information below regarding returns therefore differs from the returns in other share classes.
Before making any final investment decisions, please read the prospectus, its Annual Report, and the KID of the relevant Sub-Fund here
[/et_pb_text][et_pb_text admin_label="Tillbaka-knapp" _builder_version="3.0.89" background_layout="light" border_style="solid" custom_margin_tablet="||17px|" custom_margin_last_edited="on|desktop" module_class="gen-back-button hide-in-print" border_style_all="solid"]
This material is marketing communication
[/et_pb_text][et_pb_text admin_label="Datum / Skriv ut" _builder_version="3.0.89" background_layout="light" border_style="solid" custom_margin_tablet="||17px|" custom_margin_last_edited="on|desktop" module_class="gen-single-news-date-module gen-trustee-print-module hide-in-print" locked="on" border_style_all="solid"]
[blog_post_date]
Print
[/et_pb_text][et_pb_text _builder_version="3.0.89" background_layout="light"]
Monthly Newsletter Coeli European – February 2024
FEBRUARY PERFORMANCE
The fund’s value decreased by 0.8% in February (share class I SEK), while the benchmark increased by 0.5%. Since the change of the fund’s strategy at the beginning of September this year, the fund’s value has increased by 9.3% compared to a decrease of the benchmark by 0.4%. Both measured in SEK.

 * Adjusted for spin-off of Rejuveron** Includes September 1 (strategy change to active long-only as of September 4, 2023). Please Note: On the 4th of September 2023, the strategy of the fund officially changed from a European long biased equity long/short fund to a European active long only fund. Simultaneously, the name changed from Coeli Absolute European Equity (AEE) to Coeli European.
EQUITY MARKETS / MACRO ENVIRONMENT
Another intensive reporting month is over, and we are, overall, satisfied with the results from our companies. The fund fell by 0.8% compared to the benchmark index, which rose by 0.5%. The biggest positive contributors in February were Biotage, Cargotec, Lindab, LVMH and Diploma, which rose by 18, 19, 9, 9 and 6% respectively. The biggest negative contributor was Rugvista which, after five strong quarters, released a report that was below expectations. Adjusted for one-off effects, the report was more or less in line with expectations. A decline of 13% was, in our opinion, an overreaction. More about that later in the company section. Our Swedish property shares also had a weak month with Corem falling 12% and SLP falling 5%.
February's big themes were, firstly, a strong inflation figure on February 13th, which led to the worst trading day since October last year. At the end of the week, however, several of the world's stock markets had closed at new highs. Impressive to say the least. On the last day of the month, the January figure for the Fed's favourite measure (the consumption deflator, PCE) was published, which was exactly in line with expectations and a certain relief was immediately visible in the form of rising share prices. The inflation rate in the US is now the lowest since the beginning of 2021!
 Source: X
The second theme was rising interest rates and a much more conservative estimate of when and how many rate cuts there will be this year. For example, the US 10-year interest rate rose from 3.9% at the beginning of the month to around 4.3%. Despite that, we got to experience the S&P500 above the 5000 level for the first time. Also, in Germany and France, the index rose in February by 4.9 and 3.9%, respectively, to new highs.
Our area of focus, small companies, did not experience the same euphoria and the asset class was overtaken by the large broad indices. It is very unusual for the S&P500 to reach an all-time high at the same time as the Russell 2000 is in a bear market state (same development in Europe). The last time it happened was in 1998 and then the development for the next 12 months was as below.
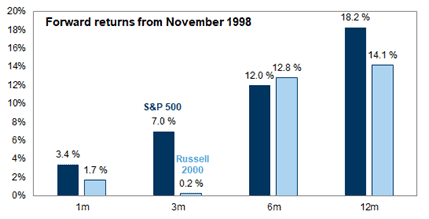 Source: Goldman Sachs
Despite recent rising interest rates, we are somewhat surprised that small caps did not have a better start to the year (even though November and December were very strong). We have received several positive economic news in recent months, which typically tends to favour small companies more than large companies. They are less diversified and thus more sensitive to economic developments than larger companies. We maintain our view that the asset class is likely to have a good 2024, with falling interest rates becoming a strong driver.
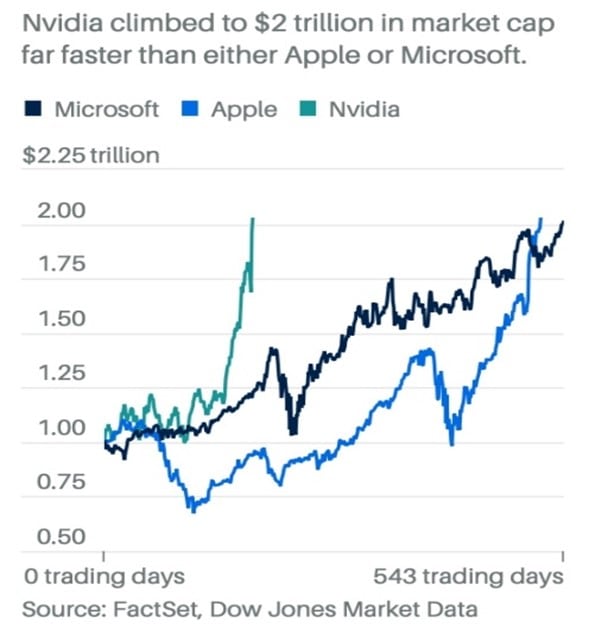
The third talking point was of course Nvidia, which is the world's best stock so far if you are looking for AI exposure. The company delivered on extremely high expectations and the figures that were published are breathtaking. In 10 years, the market capitalization has risen 220x and is now around USD 2000 billion. To put things into perspective, that's more than the GDP of Spain with 50 million inhabitants. No one has ever seen a similar development and Nvidia's report contributed to continued positive sentiment on the world's stock markets.
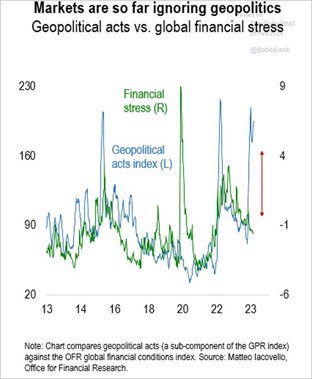
The financial stress in the systems is relatively low. Geopolitically, however, things are on red alert in many places. The markets are ignoring the development so far, which has been correct. So far, we have not seen any major spillover effects, but the human suffering is unbearable in many places.
The fourth talking point during the month was Donald Trump discussing NATO on a Saturday in Conway, South Carolina. He recounted a conversation he had with “a president of a great country”. The president of the great country had asked Trump if the US would protect them if, hypothetically, they had not paid NATO. The answer from Trump was: "No, I would not protect you. In fact, I would encourage them (Russia) to do whatever the hell they want”. You can say a lot about Donald Trump, but at least he is clear. The statement sent European defence stocks soaring for the rest of the month.
 Source: CNBC
Nikki Haley, Donald Trump's main opponent to become the Republican presidential nominee, tweeted the following clip about when Trump discussed Putin a few years ago on Fox news.
https://twitter.com/NikkiHaley/status/1759024750561464802
The standings are even between Republicans and Democrats, and it will be an interesting autumn. For an average European it is difficult to understand that a man who supported the storming of Congress and has numerous charges against him, can be re-elected.
 Source: Goldman Sachs
Paul Krugman, economist, and debater who won the Nobel Prize in Economics in 2008, is also an influential New York Times columnist. Krugman notes that Trump's desperation to delay payment of the $454 million he was ordered to pay for deliberately exaggerating his financial position shows that he, de facto, lied. He doesn't have the money. Trump has started a crowdfunding to help finance the fine. At the end of February, the collection had reached 0.3% of the amount. Keep fighting!
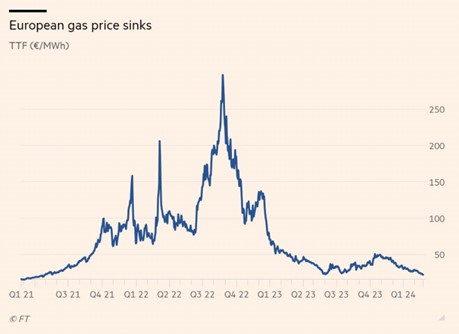
The great threat to the European economy last winter is a thing of the past. Low European gas prices are also putting pressure on Swedish electricity prices, which during some days in February were almost down to zero. Very pleasing.
 Source: Financial Times, X
Low energy prices contribute to continued downward pressure on inflation. In its recently published forecast, the National Debt Office has adjusted down the expected inflation rate (KPIF, excluding interest rate changes) to 1.7% for both 2024 and 2025. A whole percentage point lower than in the previous forecast!
 Source: SCB, Riksgälden
Even SBAB believes that ordinary CPI will drop to close to zero next year. SBAB also expects that households' real disposable income will soar from minus 6% to plus 4%. It is a huge improvement and contributes strongly to the expectation that Sweden's GDP growth will be at the top in Europe next year and also when compared to the US (3% in Sweden compared to current forecasts of 1.3% for the Eurozone and 1.7% for the US). It was a long time ago since the prospects for a strengthened krone looked so good.
 Source: SBAB
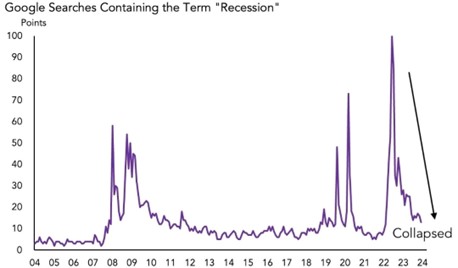
Recession as a search term on Google has crashed and optimism is beginning to flourish.
 Source: X
Revisions for the American economy have been brutal the last six months. Europe is lagging as usual, but we are probably close to a turnaround here as well. As can be seen in the picture below, the budget discipline has been mediocre for the last 15 years in the US. For how long can this go on?

PORTFOLIO COMPANIES
Biotage
Biotage was one of the fund's great joys during February. Ahead of the Q4 report, which was released during the month we had noted two things that made us believe in a good delivery:
1) In the last report (Q3) inventories had increased significantly, suggesting that the next quarter could be good.
2) The management had made valiant attempts to convince the analysts that the company's latest acquisition, Astrea, has a strong business that fluctuates a lot between quarters. Maybe to the positive in Q4? The feeling was that management was very confident with Astrea's development.
3) Astrea clearly has longer sales cycles than the rest of Biotage, which meant that management should have good visibility of what is delivered and when.
We thought these ingredients combined stirred up a great cocktail. And so, it turned out to be, with an adjusted EBITDA result that was around 60% better than expected – exceptional! The big explanation was precisely Astrea, whose sales were 50% better than expected.
The stock had been strong before the report after sector colleagues Sartorius and Lonza delivered better than expected in January. The stock nevertheless rose 14% on the day of the report and another 10% the day after. Biotage is one of the few platform companies in its niche that remains listed in the Nordics. We wouldn't be surprised if some major industrial players are eyeing up Biotage.
Below is the course development over the past year. We increased our position all the way down last autumn and going into the report it was the fund's largest position. Four months after the lowest level in October, the share has risen with more than 100%.
 Source: BloombergBonesupport
Bonesupport's stock has been a great performer and has risen 129% in one year. The stock had thus developed very strongly before the report. Adjusted for currency and non-recurring costs, Bonesupport delivered results in line with expectations, having beaten estimates five quarters in a row. This was interpreted as a sign of weakness by the market and the share fell approximately 5% on the day of the report and as much as 9% the following day. We took advantage of the turbulence and bought more shares.
We have not made any changes to our estimates following the report. Carnegie's analysts were with Bonesupport at the AAOS (American Academy of Orthopedic Surgeons) in San Francisco and felt that the interest in Bonesupport's products is very high in the US. Carnegie also released a major update on penetration and the market in the US and raised the target price from SEK 235 to SEK 285.
SLP
The logistic property company SLP released a report in February where the management result was 4% better than expected. Rental income increased 42% compared to last year and we believe SLP can continue to make opportunistic acquisitions in 2024 with its strong balance sheet.
SLP trades at a premium of 3% to our estimated net asset value at the end of 2024, with an unchanged yield requirement. It's way too cheap for a real estate company with a high yield requirement (5.9%) and very strong growth. Should the yield requirement not fall in 2024, it will most likely do so in 2025 and thus drive the NAV development.
Cargotec
Cargotec submitted a report on the first day of the month. The company's operating profit was 9% worse than the estimate. Even more important though was that order intake was 5% better than expected, which the market took note of. Subsequently, order intake grew by 11%, which indicates that the development may have bottomed out at this point. The share was rewarded with an increase on the report day of approximately 6%.
Despite the strong rally over the past month, the stock is still cheap at around 9x earnings. The company also has a strong balance sheet and net cash. Work on dividing Cargotec into several companies continues and it is likely that the Kalmar subsidiary will be listed on the stock exchange on the first of July this year if no other player buys the company.
Corem
Corem announced a result in line with our and the market's expectations. Indexed rental income has compensated a lot for increased financing costs. The company's average interest expense had actually fallen during the quarter, which is partly explained by the fact that some expensive bonds were bought back. Net lettings were negative in the quarter with -7 million, but for the full year net lettings were +83 million. During the year, properties were sold for 14.6 billion with a profit effect of 626 million including dissolved tax.
In total, Corem has made a downward revision of its property values by 11% during the year and by 14% since the highest levels in spring 2022. The average yield requirement used in the valuation at the end of the year was 5.8%, which is to be compared with 4.9% in Q1 2022 This has pushed the net asset value to SEK 17.6 at the end of the year (to be compared with the share price around SEK 9.50). The share was under strange pressure in connection with the presentation of the results and this may be because investors perceived a reduced dividend from SEK 0.40 to SEK 0.10 negatively. We have pushed for a scrapped dividend as we think it is much better for the company to buy back expensive debt as soon as possible. We took advantage of the price pressure and increased our position. So did principal owner Rutger Arnhult, who on three occasions announced the purchase of shares for just over 4 million.
Corem is one of the real estate companies that will benefit the most when interest rates retract. Partly in terms of reduced interest costs and thus an increasing cash flow and partly in terms of a falling yield requirement that begins to build up the net asset value again.
Campari
In November, after the last quarterly report, we began cautiously buying into Campari. The company is a shining star in the beverage industry with a premium brand portfolio that drives growth to levels well above that of the industry. The most important drink, Aperol (24% of total sales) had an organic growth of 23.1% in 2023. The second most important drink is Campari with 10.7% in organic growth (11% of total sales). Since 2019, the group has organically grown by as much as 60%, but at the same time the operating margin has fallen slightly. The reasons for this are rising agave prices (raw material for tequila), generally rising costs due to inflation, and also increased depreciation, when production capacity was increased to meet the high demand.
The quarterly result was almost 30% better than expected and the share rose 5-6% initially. It later turned out that one reason for the strong result was that marketing costs were reduced, and adjusted for that, the result was in line with expectations. The next day, the stock fell a few percent. With a very high probability, margins will improve significantly this year while sales growth continues. It is falling agave prices as well as lower glass prices that will come through with full force in the second half of this year. We are not yet fully invested but think today's valuation of 22x and 20x respectively in P/E numbers for 2025-2026e is attractive given all the quality Campari possesses.
Euronext
Euronext, which owns several European exchanges, came out with another solid report in February. The result was somewhat better than analysts had expected. Although the stock has risen more than 20 percentage points better than the index since the initial purchase, the company is still valued below its historical average on forward-looking earnings. This is even though the share of revenue that comes from non-volume-related revenue (stock trading, etc.) has risen to 58% in 2023, compared to 44% in 2018. This has made the business more predictable, which we believe should be valued at a premium.
London Stock Exchange
Another exchange that we own is the London Stock Exchange. However, the income is highly diversified and only a very small part of the income comes from the trading of shares in London. Most of the company's revenue is instead generated from various types of data operations – among other things, the company sells real-time prices, risk data and indices (FTSE Russell). As in the case of Euronext, the moats are high and the earnings predictable. During the month, figures for the full year 2023 were reported which were in line with expectations.
CVS Group
The veterinary company once again reported results that were in line with expectations. However, management's outlook was cautious, citing inflation and weak macro trends. That, combined with the fact that there is an ongoing case with the CMA (Competition and Markets Authority) that keeps the stock market on a leash, caused the price to fall 13% in February. The influence on the fund's development for the month was clearly limited because we have a small position in the company.
Rugvista
The Rugvista share had a weak month with a decline of -13%. In February the company's Q4 report was released which had better organic sales than we expected, but with an EBIT result that was 23% worse than what the analysts had expected. If we take the liberty of adjusting for a negative currency effect and what can be considered non-recurring costs, we; however, arrive at an operating result quite well in line with the estimates. The most important thing for us is that sales develop positively while we see leverage in the new platform rollout, and we think we saw that in the Q4 report. The stock is valued on our estimates at a low 10x and 9x EBIT for 2024e and 2025e respectively.
Surgical Science
The second disappointment of the month came from Surgical Science. The company's results came in strongly during the advance predictions. Even adjusted for a relatively large currency loss, the result was weak. The reason is particularly attributable to weak sales within the Educational Products business leg. Having said that, the most important thing is that the company's OEM leg is developing strongly – in 2023 the company managed to grow license revenues within this leg by 50%. The management affirms that they continue to strongly believe in the company's financial goals for 2026 - should these be achieved, there is great potential for the share.
SUMMARY
The reporting season is now largely over, and the conclusion is that the companies have once again delivered good results. In Europe, it is primarily the profits that have surprised positively, while turnover growth has been somewhat more modest. Below illustrates the deviations for the companies within the broad STOXX 600 index.

Despite earnings beating expectations, 2024e EPS estimates in Europe have fallen slightly in recent weeks. Analysts have either been too optimistic and/or the companies have been cautious with their outlook at the beginning of the year. This contrasts with the United States, where estimates have risen slightly. However, both geographies offered rising share prices in February except for the self-torturer Great Britain, which continues to develop weakly. Various studies have concluded that Brexit has so far cost the UK £140 billion a year, which equates to a total of 6% of GDP. Since the Brexit election, the FTSE100 has risen, measured in euros, by a mediocre 13%...Well done.
 Source: UBS
At the moment there is an unusual amount to be happy about when it comes to economic development. Inflation is falling, interest rates are falling, real wages are rising, bottlenecks have disappeared, European valuations are low, expectations are relatively low, and it currently looks like economies are soft landing. It is no coincidence that many stock markets trade at record highs. Below are some flash headlines from the end of the month from two Fed members.
*BARKIN: INFLATION IS COMING DOWN, SHOULD BE CHEERING 2.4%
*GOOLSBEE: WOULDN'T BE SURPRISED IF JANUARY INFLATION WAS NOISE
*FED'S GOALSBEE: I BELIEVE FED FUNDS RATE IS QUITE RESTRICTIVE
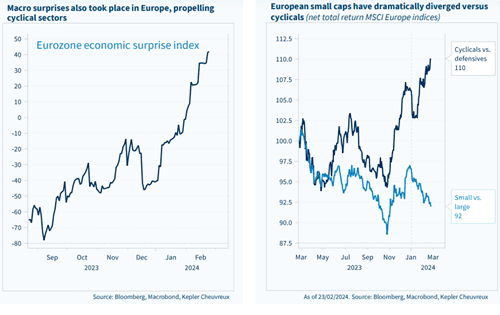
The image below on the left shows a surprise index that contains a number of economic sub-components. Europe is on the move from low levels. A major warning should be issued to the ECB, that if they continue to build on their weak track record, they will cut rates too late and unnecessarily create an extension of the downturn. Our view of the ECB's strategy is that they are sitting and waiting to see what the Fed will do. One of the problems with the uninspiring strategy is that the US and the Eurozone are in completely different economic phases. Following European inflation data on Friday, March 1, which was slightly higher than expected, the ECB is now expected to make its first interest rate cut in June, cutting rates by a total of 0.92% this year.
The pictures below also explain why we are somewhat surprised that small caps had a somewhat mediocre start to the stock market year. This also applies to American small caps.
The answer (we think) to why small caps are lagging in the lead-up to 2024, is the recoil we've had with rising interest rates. This asset class, as we all know and have experienced, dislikes rising interest rates. But it seems reasonable to believe that we will see the opposite effect when interest rates gradually fall during the year.

The image below shows, just like the image above, that it is still the interest rate that determines valuations in Europe. Companies' earnings are of course important, but it was a falling interest rate that largely drove share prices upwards during the last quarter of last year. The correlation between P/E ratios, inverted interest rates and credit spreads is close to 1. With high probability, the correlation will persist as interest rates fall, thus driving up multiples and valuations.

We are at slightly overheated levels. Below is the Goldman Sachs sentiment indicator for the US stock market.
 Source: Goldman Sachs
If history is to repeat itself again, prices will go downhill since The Economist has published the front page below.
 Source: The Economist
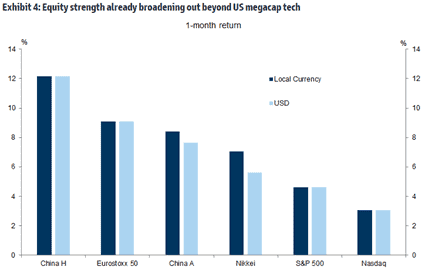
In the US, it is the companies that are expected to be the biggest net buyers of US stocks this year. An observation that the undersigned made during this year's first reporting season is that there have probably never before been so many and large buyback programs announced by European companies. That's a big change in a relatively short period of time and for us it signals optimism, strength in balance sheets and what we hope is frustration at overall low valuations. We applaud the development and a step in the right direction to create shareholder value with our (your) capital.
 Source: Goldman Sachs
The last month has seen gains in several places and Europe is asserting itself well. That Europe is undervalued is not news. But the combination of the US being at high levels, at the same time as European companies have announced many new buyback programs, is a catalyst that attracts new and welcome capital to the market. The picture also clearly shows that investors believe in a turnaround in the sluggish Chinese economy.
 Source: Goldman Sachs
Another way to illustrate low values in Europe.

In summary, the economic outlook in Europe, after two difficult years, is better than it has been for a long time and after the summer there may be a visible improvement all around us, not least in Sweden. That combined with low expectations, with a large element of scepticism, is an unusually attractive combination.
After an intense February, we are now entering a period where we can spend more of our time on analysis of existing and potentially new companies.
Thank you for your interest!
Mikael & Co
Malmö March 6th, 2024
[/et_pb_text][et_pb_post_title _builder_version="3.0.89" title="on" meta="off" author="off" date="off" categories="off" comments="off" featured_image="off" featured_placement="below" text_color="dark" text_background="off" border_style="solid" module_class="gen-single-news-heading-module gen-trustee-single-headline" date_format="d M, Y" border_style_all="solid" disabled_on="on|on|on" disabled="on" /][et_pb_text admin_label="Coeli Nordic Corporate Bond Fund R-SEK" _builder_version="3.0.89" background_layout="light" module_class="gen-table-module" disabled_on="on|on|on" disabled="on"]
Coeli Nordic Corporate Bond Fund
| Performance in Share Class Currency | 1 Mth | YTD | 3 yrs | Since incep |
| Coeli Nordic Corporate Bond Fund - R SEK | 1.30% | -0.93% | 3.38% | 14.52% |
| | | | |
[/et_pb_text][et_pb_text admin_label="Coeli Nordic Corporate Bond Fund R-SEK" _builder_version="3.0.89" background_layout="light" module_class="gen-table-module" disabled_on="on|on|on" disabled="on"]
[cg_linear_graph id="31122"]
[/et_pb_text][et_pb_image _builder_version="3.0.89" src="https://coeli.com/wp-content/uploads//2020/10/ncbr.png" show_in_lightbox="off" url_new_window="off" use_overlay="off" always_center_on_mobile="on" force_fullwidth="off" show_bottom_space="on" disabled_on="on|on|on" disabled="on" /][et_pb_image _builder_version="3.0.89" src="https://coeli.com/wp-content/uploads/2019/01/Gustav-Fransson6.jpg" show_in_lightbox="off" url_new_window="off" use_overlay="off" always_center_on_mobile="on" force_fullwidth="off" show_bottom_space="on" custom_margin="||21px|" disabled_on="on|on|on" disabled="on" /][et_pb_text admin_label="Namn och title" _builder_version="3.0.89" background_layout="light" module_class="gen-single-ingress-module" custom_margin="||40px|" disabled_on="on|on|on" disabled="on"]
Gustav Fransson
Portfolio Manager of Coeli Nordic Corporate Bond Fund
[/et_pb_text][et_pb_image _builder_version="3.0.89" src="https://coeli.com/wp-content/uploads/2018/10/Alexander-Larsson-Vahlman.jpg" show_in_lightbox="off" url_new_window="off" use_overlay="off" always_center_on_mobile="on" force_fullwidth="off" show_bottom_space="on" custom_margin="||21px|" disabled_on="on|on|on" disabled="on" /][et_pb_text admin_label="Namn och title" _builder_version="3.0.89" background_layout="light" module_class="gen-single-ingress-module" custom_margin="||40px|" disabled_on="on|on|on" disabled="on"]
Alexander Wahlman
Senior Analyst
[/et_pb_text][et_pb_text admin_label="Top Holdings (%)" _builder_version="3.0.89" background_layout="light" custom_margin="||20px|" module_class="gen-trustee-single-table" disabled_on="on|on|on" disabled="on"]
Top Holdings (%)
| LANSBK 1.25% 18-17.09.25 | 4.1% |
| NORDEA HYP 1.0% 19-17.09.25 | 4.1% |
| SWEDBK 1.0% 19-18.06.25 | 4.1% |
| WHITE MOUNT FRN 17-22.09.47 | 3.9% |
| B2 HOLDING FRN 19-28.05.24 | 2.9% |
[/et_pb_text][/et_pb_column][/et_pb_row][et_pb_row _builder_version="3.0.89" background_position="top_left" background_repeat="repeat" background_size="initial" module_class="gen-single-news-content-row gen-trustee-single-content-row" custom_padding="0px|||" custom_padding_phone="23px|||" custom_padding_last_edited="on|tablet" module_class_2="gen-trustee-single-sidebar" disabled_on="on|on|on" disabled="on"][et_pb_column type="2_3"][et_pb_text admin_label="Tillbaka-knapp" _builder_version="3.0.89" background_layout="light" border_style="solid" custom_margin_tablet="||17px|" custom_margin_last_edited="on|desktop" module_class="gen-back-button hide-in-print" border_style_all="solid"]
Note that the information below describes the share class (I SEK), which is a share class reserved for institutional investors. Investments in other share classes generally have other conditions regarding, among other things, fees, which affects the share class' return. The information below regarding returns therefore differs from the returns in other share classes.
Return to Fund page
[/et_pb_text][et_pb_text admin_label="Datum / Skriv ut" _builder_version="3.0.89" background_layout="light" border_style="solid" custom_margin_tablet="||17px|" custom_margin_last_edited="on|desktop" module_class="gen-single-news-date-module gen-trustee-print-module hide-in-print" locked="on" border_style_all="solid"]
[blog_post_date]
Print
[/et_pb_text][et_pb_post_title _builder_version="3.0.89" title="on" meta="off" author="off" date="off" categories="off" comments="off" featured_image="off" featured_placement="below" text_color="dark" text_background="off" border_style="solid" module_class="gen-single-news-heading-module gen-trustee-single-headline" date_format="d M, Y" border_style_all="solid" /][et_pb_text _builder_version="3.0.89" background_layout="light"]
Utveckling september
Fondens värde sjönk -5,1 procent i september (andelsklass I SEK). Stoxx600 (brett Europaindex) sjönk under samma period med -3,4 procent och HedgeNordics NHX Equities var preliminärt oförändrat. Motsvarande siffror för 2021 är en ökning om +21,6 procent för fonden, +14,0 procent för Stoxx600 och +6,4 procent för NHX Equities.


Equity markets / Macro environment
After seven consecutive months of positive performance the world’s stock markets were poised for some degree of turbulence. Volatility was especially high in some equities and on Monday, September 20, the highest nominal volume ever traded was reached in options on the S&P500 (!) The broad European index fell by 3.4 percent in September compared to the S&P500 which fell by 4.8 percent. The fund also had its first negative performance since October last year with a decline of 5,1 percent. More about that later.
Despite high levels for many stock indices, sentiment among investors has been relatively gloomy. Bank of America's monthly survey recently showed that only 13 percent of managers expect a positive market in the future, which is the lowest figure since April 2020 (and that was clearly wrong). The reasons cited are China's growth problems, the crisis-stricken Chinese real estate giant Evergrande, the development of the delta variant, declining profit growth and, of course, rising inflation. However, they are still overweight equities which is perhaps not so strange when you have to pay to lend your capital to countries. As interest rates rose at the end of the month, the German 10-year interest rate followed with a giant step from - 0.25 percent to - 0.17 percent… The picture below is an overall risk indicator, and we are around zero (neutral).

The news flow in September began with record high inflation figures in Europe at +3.0 which exceeded market expectations. The corresponding figure in July was + 2.2 percent. It was the fastest growth rate since November 2011 and several countries recorded up to five percent in inflation rate. The pressure on the ECB to reduce its support measures is increasing. On Friday, October 1, new inflation figures came in for September, which showed a further acceleration in the inflation rate by +3.4 per cent.
The rate of change can be mostly attributed to rising energy prices that are starting to create real problems in the world's economies as well as agricultural shifts. The picture below shows that food prices are at record high levels over the past 60 years. The biggest losers are the poorest part of the population.

In the slightly longer term it is forecasted that it is not excessive demand that will drive inflation, but rather a limited supply, and then both in terms of products and labour. At the end of September, long queues were reported at petrol stations across the UK when fuel ran out and there were not enough truck drivers to refuel. Prime Minister Boris Johnson urges his citizens to refuel sensibly and at a normal rate. You wanted Brexit, so there you go. In sheer desperation, Johnson has now issued 5,000 temporary short-term visas for temporary drivers. Good luck.
M25 spring 2022?

Below are European gas prices which have risen in a seemingly uncontrolled fashion and recorded the highest September prices ever. A silent prayer for the mild winter. We guess that this development will soon be a major topic in the media, and it will undoubtedly create various problems and somewhat reduce next year's expected growth. It feels reassuring that Per Bolund (Swedish Green Party MP) claims that there is no electricity shortage in Sweden because then the costs for ordinary people would be unbearably high during the winter (which of course they will be). Rising gas and electricity prices have led European politicians to start discussing billion-dollar subsidies (in euros) to households and manufacturers who will experience sharply rising electricity bills over the winter.

Source: Bloomberg
Henrik Svensson, site manager at the oil-fired power plant in Karlshamn (south Sweden), does not agree with Per Bolund that we have a surplus of electricity in the country. For large parts of September, the power plant ran at full capacity and burned 240k liters of oil per hour. Henrik Svensson believes that it is electricity shortages and high electricity prices that are behind the high production. He also says that there is a lack of planned power production in southern Sweden and that it will take many years before the electricity grid is strengthened and new electricity production is in place. Sweden today burns more oil than we have done in 10 years. A gigantic energy policy and climate policy failure signed by the Green Party.

Source: Steget efter
Winning candidate for this year's Christmas presents below.

The change in the US 10-year interest rate created considerable pressure on, primarily, growth stocks at the end of the month. The performance dispersion for different sectors was very large in September with oil shares as a clear winner. This was also felt in the last days of September.

Source: Bloomberg
Below is the development for the US 10-year interest rate. The turbulence in the stock market was caused by the change in interest rate level breaking through on the upside, as can be seen in the chart.

There have been countless attempts to explain the turbulence in recent weeks. The recent and significant amount of options being exercised, Evergrande, interventions by the Chinese government, Fed tapering, Bank of England expected to raise interest rates, delta variant, inflation, bottlenecks in production, difficulties in finding staff, rising energy prices and declining growth rates. We think it is enough to look at the picture below. Rising interest rates hit hard at growth companies' valuations.

Goodbye Mutti and thank you for an extraordinary effort for Europe!

Source: Nyhetsbyrån TT
She was politically in a class of her own during the euro crisis ten years ago and Sweden also has her to thank for a lot. Despite a somewhat weaker performance in recent years, German citizens have experienced significantly better economic development than many others.

On September 29, the covid-19 restrictions in Sweden were finally removed and we can now, in principle, start living a normal life again. The number of bookings for winter holidays skyrocketed to the great joy of the tourist and transport industry. In recent months, tourism activity in the Mediterranean has been "extraordinary" and much better than forecasted before the summer. Luxury travel is also reaching new heights. Private jet passengers to Mallorca increased by +70 percent in July compared to July 2019 with an average of 83 private jets per day landing in Palma. If you want to rent a yacht, you are being referred to next year as basically everything has already been fully booked.
We now belong to a minority group. Passively managed capital exceeds actively managed capital for the first time ever. This will give us more opportunities as mispricing increases.

In addition to being one of the world's best stock markets this year, Sweden also has the most listed companies in the entire EU. Bloomberg drew attention to the fact that there are now around 1,000 listed companies on the various trading platforms in Stockholm. More than 80 percent are smaller companies, and the list is filled with new listings every day until Christmas! For us, it is interesting as we are constantly looking for new potential core holdings. In recent weeks, we have identified one which we write about under Long Positions.
We end this section with a picture that well reflects today's political level.

Source: Kluddniklas
Long positions
Truecaller
During September, we did a lot of work on the Swedish company Truecaller which will go public on October 8th. Truecaller is one of the most interesting companies we’ve seen in recent years. Truecaller has developed a phone application that can, among other things, identify unwanted calls from, for example, telemarketers. The app is one of the top ten most downloaded applications globally, and in some of the main markets such as India, Nigeria and Indonesia, it is one of the three most downloaded apps. As a Swedish company with headquarters in Stockholm, the firm has chosen to list on the Swedish stock exchange, which we are very happy about.
Truecaller was founded in 2009 by Alan Mamedi and Nami Zarringhalam. They met at the Royal Technical University in Stockholm, and they continue to be active in the company as the CEO and Chief Strategic Officer (CSO), respectively. When they released the first version of the app, they received 10,000 downloads within one week. By 2013 they had reached over 10 million users globally and in Q2 2021 they had reached 278 million monthly users. Throughout their journey, Truecaller has attracted several well-known investors such as Sequoia Capital (early investors in Apple, Whatsapp, and Zoom among others), Atomica (Skype-founder Niklas Zennström’s investment company), and Kleiner Perkins (early investors in Google, Amazon, and Spotify among others).

Until recently, revenue streams have mainly consisted of income from in-app advertising. In addition to this, there is a premium version where paying users can get additional functionalities. That business accounted for around 20 percent of revenues in 2020. During the fall of 2020, Truecaller launched a corresponding offering that targets corporates. This part of the business allows B2B customers to be listed as verified callers when they call private people. It can for example be a security company that calls about an alarm or a courier company that needs to get in contact with a receiving customer. It is a common problem that these types of companies get rejected when the call-receiver doesn’t recognize the number.
Truecaller declares that their product benefits from network effects. i.e., the product gets better the more people who use it (think Facebook). This can be relatively easy to appreciate since phone number identification inherently evolves from reporting of unwanted calls by the users, i.e., when enough people have reported an unwanted call Truecaller flags for this in the app). Over time, Truecaller has built a database containing 5.7 billion unique phone-identities. Network effects doesn’t just build a better product over time, they also increase the entry-barriers for potential competition.
The majority of Truecaller’s income comes from developing countries. The company explains that the problems related to spam emails, harassment, unwanted calls, and messages are more common there than in the western world. India is Truecaller’s largest market where these types of problems are significant. One positive aspect of the geographical exposure is that it allows for a nice structural tailwind: the population growth in developed markets is much higher than in the west (driven by an increasing average age) and the smartphone penetration is growing fast.
Historically, 97 percent of all app downloads have been organic. However, management has begun to experiment with user acquisitions by the way of advertisements through, for example, Facebook. The returns on user acquisition looks extremely attractive. In some markets, such as India, Truecaller could achieve a return on investment of up to 20x on every spent dollar. In more mature markets, such as the USA, the same multiple amounts to 4x, still very attractive. Indonesia, which is a relatively new market to the company, has a multiple of 0.8x. This means any user acquisition spend in Indonesia is unprofitable at this point. However, management is confident that the return profile will wander above the 1x as more users join and the network effects take place. In summary, the investment opportunities are plentiful and attractive – and unique.
In summary, several things speak for significant growth in the future. The investment in paid user acquisition, a sharpened premium-offer, the newly launched B2B product and continued growth of the advertising business. In addition to this, acquisitions may likely follow.
Growth has been prioritized over profitability and it is only recently that the company began to report profits. In 2019 sales grew by 57 percent. In 2020 the corresponding figure was 64 percent, and during the first half of 2021 the company’s sales grew with as much as 151 percent in comparison to the same period last year (which was partly affected by the pandemic). During the first half of this year, the company’s operating margin was 32 percent. As you can imagine, Truecaller is very capital-efficient. Working capital is very low which gives a nice cash conversion and a very high return on capital employed – all attributes that are required to create a very successful and valuable company over time.
Truecaller targets a revenue growth of at least 45 percent between 2021-2024e. After 2024 the EBITDA-margin should be at least 35 percent. The sum of the year-on-year growth and the EBITDA-margin should amount to at least 70 percent (a variant of the rule of 40 that tries to balance growth and profitability). We don’t think it will be difficult to reach these targets and the analyst estimates we have looked at are cautious, especially regarding profitability. In our preliminary prognosis for 2023, our EBITDA-estimate is around 16 percent ahead of the analyst estimates that we’ve studied. This is based on that Truecaller can continue to grow sales much faster than hiring new people while the gross margin improves slightly in coming years.
The gross margin is an interesting aspect of the equity story. Truecaller’s gross margin amounts to approximately 70 percent. Most of the cost of sales consists of platform fees to Apple and Google. Since Apple and Google practically control the distribution channels for apps together, a duopoly has occurred and prices for app-developers such as Truecaller have remained high around 25-30 percent of sales. This situation is now heavily criticized from all parts of the world since the situation is not considered competitive, for example
look at this analysis about an American court ruling concerning a twist between Epic Games and Apple. We believe Google and Apple’s fees will decrease over time – which would be a positive event for Truecaller. Furthermore, Truecaller’s new business deal bypasses Goggle and Apple, which gives a gross margin of close to 100 percent. This will strengthen the profitability even more.
There are of course risks associated with the dependence on Google/Apple (which is the case for every company in the application business); the geographical exposure and one should never write off the threat of competition even if it seems far away at this stage. However, we do believe the benefits outweighs the negatives. Truecaller has excellent financial characteristics, operational founders with large shareholdings who will remain active in the business and some of the world’s most well-known investors behind it. We therefore look forward to being included as an anchor investor ahead of the stock exchange listing on October 8th. We are even more excited to follow the company’s successes in current and new markets in the coming years.
CVS Group
One of the happiest days of the month was when our veterinarian company CVS Group released their interim numbers. Once again, the company beat analysts’ expectations which have been raised several times over the course of the year. In the first two months of the new financial year (which begins in July), the company has grown by 17 percent. This can be compared with the growth expectations for the full year which, before the report release, were 7 percent. Once again, analysts have thus far been “forced” to upgrade their assumptions. In a sour September stock market, the share fell 3 percent.
It becomes clear that the positive effect of the pandemic on pet ownership is more tenacious than ever. Pets live for many years, and we believe many underestimated the importance of the large number of new customers during the pandemic. Below is a graph of Google searches for veterinarians in the UK as well as data from the Swedish Board of Agriculture regarding the number of newly registered dogs. We speculate that the UK has similar trends as Sweden. The data points are also positive for our other pet company Swedencare. Pet companies are obviously still hot; right now there’s a bidding war going on over the German pet company Zooplus, where EQT is currently in the lead with the highest bid. We also note that there have been several venture capital-led acquisitions of veterinary companies at higher multiples than CVS is valued at.

Source: Jordbruksverket, Coeli

Source: Google Trends, Coeli
Lindab
Since our first investments in Lindab in the autumn of 2019, the thesis has always been that the building systems business segment did not fit into the business and in September, management finally found a buyer for the company. The transaction entails a write-down of goodwill corresponding to SEK 430 million, but it is cash flow neutral. Lindab took the opportunity to update its financial targets; the company now wants to grow by 10 percent per year (of which approximately two thirds are through acquisitions) and reach an operating margin of at least 10 percent (previously 10 percent over a business cycle). The share responded positively to the message.
We noted broad insider purchases in Lindab during the month, also from CEO Ola Ringdahl himself, which we think bodes well for the report in October. Despite this the share price decreased 8 percent in September.
Victoria
We have written several times about the British flooring company Victoria, which in September had a weak share price development of 17 percent. By all accounts, the company is doing well – during the month it was reported that sales rose 70 percent compared to 2020, and 50 percent compared to 2019. If you only partially extrapolate these figures for the rest of the year, it is obvious that analysts’ expectations are too low. We believe that this month’s decline is related to flows: growth companies and small and mid-cap companies were some of the most affected sectors in September – Victoria was hit from both sides. We have increased our position in recent days.
The Pebble Group
One of the month’s (few) joys was Pebble Group. As we previously wrote, the company is active in the market for gift advertising, i.e. gifts that companies give to customers, employees, and other stakeholders for marketing purposes. In September the company came out with its half-year figures that were better than expected. Pebble’s software division, Facilisgroup, is growing better than our expectations. This is also the part we believe the market is valuing too low. The stock rose 10 percent in September.
Knaus Tabbert
During the last trading day in September, our German motorhome manufacturer Knaus Tabbert announced that the forecasts for 2021 must be lowered due to component shortages. We are not particularly surprised that this has happened given what we have seen from other vehicle manufacturers. If the company can remedy these supplier problems, management believes that 2022 will be unaffected at best, as Knaus still has a bursting order book, increased production capacity and more suppliers from January next year. The share fell 7 percent in September.
Short positions
The short portfolio contributed with a negative result during the month. Our short-term negative positions in the German DAX had the largest negative contribution. Some stock specific short positions that contributed positively to the result were Swedish Dometic, German Henkel and Norwegian NEL.
Exposure
The net exposure, adjusted for our unlisted holdings, at the beginning and end of the month was 76 and 74 percent, respectively.
Summary
September's negative return of x percent also meant the end of the fund's, so far, longest period of positive return (10 months). We are obviously disappointed with that, but we have been in the game long enough to understand that equities sometimes must fall to be able to refuel and continue their upward trajectory. In general, September was the weakest month for many equities since the crisis started 1.5 years ago. September, otherwise, started strong for us and was a continuation of an unusually good performance at the end of August. Our companies presented many good news (except for Knaus Tabbert on the last day of the month) but small-caps and especially those categorized as growth shares, had a very weak performance during September. The main reason for this was, as previously mentioned, the change in the US long-term interest rate and general "risk off".
The picture below shows the development since March last year compared with the corresponding time intervals in the financial crisis in 2009 and onwards. Both periods have shown an unusually strong recovery and the current trend is even stronger than when the financial crisis raged 12 years ago.

Source: Goldman Sachs
Since the crisis started 1.5 years ago, we have had three different phases. The first and shortest, "despair", showed a decline in prices of 33 percent. The second phase, "hope", ended at the beginning of this year and showed a very strong return of 79 percent despite declining earnings. The last, “growth”, where we are now, has shown +11 percent in share prices with sharply rising growth for companies' earnings, but at lower valuations.

Source: Goldman Sachs
The recovery for American companies (below) has been extremely strong and compared to 2019, the 2021 profits will be approximately 36 percent higher. Very impressive.

Source: Goldman Sachs
It is very gratifying that Europe, for once, is keeping up with the United States and showing strong profit growth. Compare this with the non-existent profit growth between 2007–2019 (!)

Despite rising equity prices, valuations have fallen and Europe is now trading around 16x the profit 12 months ahead. It's not very strenuous (we think). For an average commercial property, you can get a return of maybe 3 percent before net financial costs. After financing, this corresponds to at least P/E 50x. And paying to lend to different countries does not feel like an exciting alternative either.

Source: Goldman Sachs
The valuation of global shares in relation to global GDP looks more strained. A major reason for this is the central banks' aggressive policy.

The valuation of the major leading technology companies is at an average level seen from the last five years.

Source: Goldman Sachs
The image below is striking. It shows that Swedish property prices, which have risen by almost 200 percent over the past 15 years, have had the same development as the money supply. In theory, price per m2 and krona is unchanged for the past 15 years. Is there anyone who still doubts that the world's central banks are responsible for the largest wealth creation in human history? It is important to be on the wagon because when it is gone you’ve missed it. And what central banks cannot push, the price of bitcoin for example, rises even more as central banks cannot make more of it. The opportunities for central banks to reverse the band are few. In the long run, this means that the next 10 years will, overall, be a good period for, for example, stock picking. All forms of uniqueness (growth) will be highly valued to compensate for the fact that the value of money decreases at a rapid pace.

If there is anyone who is still not convinced, take a look at the picture below. The market capitalization of the S&P500 divided by the Fed's balance sheet….

Source: Bloomberg
Onwards and upwards. The wealth of American households is accelerating away from the change in GDP.

Thank you Fed and all the world central banks!

Citigroup's surprise index has weighed down and analysts' profit estimates are also starting to soften. Not a good combination and it has undoubtedly contributed to the weak development in the stock markets recently.

It took a full 219 days for the S&P500 to have a decline of 5 percent. We will see how high the next bar will be.

Timing is everything. A fascinating graph that shows the importance of having reasonable timing in decisions.

Source: Goldman Sachs
Despite a difficult month behind us, it feels reasonable to expect a stronger market during the last quarter of the year. Our view is that we are still in a rising market, although we are likely to experience some turbulence for a few more weeks. "Bear markets" are constantly declining with sharp rallies while "bull markets" continue to rise with some strong drawdowns. We therefore believe that we are still in a rising market.
Some statistics to cheer you up. The S&P500 managed to rise by 0.2 percent in the third quarter (Europe -1.9 percent) which means six consecutive positive quarters. This has only happened eight times before and only on one of the (eight) occasions has the following quarter yielded a negative return. Two quarters later, it has in all cases yielded a positive return. In addition, for the past 20 years, October has been the fourth best month, thus much better than its reputation. Having pointed that out, October takes first place in terms of most frequent daily movements that exceed one percent.
The Stockholm Stock Exchange, which is an excellent reference point, had risen by 30 percent at its highest about a month ago, but is currently at 20 percent. Even more important is that measured in USD, OMX has "only" risen by 13 percent, which is in line with the US stock markets. This is hardly excessive given the profit growth among the companies. The risk premium in the market is high.
Investors are reasonably careless, and we are approaching the turn of the year. Global growth is well above average and interest rates are extremely low. Given how cruel the market has been to many investors this year, with sector rotations and a high concentration of companies driving performance, it almost feels obvious that the broad mass of investors will continue to reduce risk in their portfolios and then be short equities at year-end when the market rises. We'll see, but that's our main scenario right now.

We are now closing the books for the third quarter, and we look forward to the end of the year and above all the entrance for Truecaller on the Stockholm Stock Exchange on October 8!
Thank you for this month and we'll hear from you later.
Mikael & Team
Malmö on 5 October
[/et_pb_text][et_pb_text admin_label="Coeli Nordic Corporate Bond Fund R-SEK" _builder_version="3.0.89" background_layout="light" module_class="gen-table-module" disabled_on="on|on|on" disabled="on"]
Coeli Nordic Corporate Bond Fund
| Performance in Share Class Currency | 1 Mth | YTD | 3 yrs | Since incep |
| Coeli Nordic Corporate Bond Fund - R SEK | 1.30% | -0.93% | 3.38% | 14.52% |
| | | | |
[/et_pb_text][et_pb_text admin_label="Coeli Nordic Corporate Bond Fund R-SEK" _builder_version="3.0.89" background_layout="light" module_class="gen-table-module" disabled_on="on|on|on" disabled="on"]
[cg_linear_graph id="31122"]
[/et_pb_text][et_pb_image _builder_version="3.0.89" src="https://coeli.com/wp-content/uploads//2020/10/ncbr.png" show_in_lightbox="off" url_new_window="off" use_overlay="off" always_center_on_mobile="on" force_fullwidth="off" show_bottom_space="on" disabled_on="on|on|on" disabled="on" /][/et_pb_column][et_pb_column type="1_3"][et_pb_image _builder_version="3.0.89" src="https://coeli.com/wp-content/uploads/2019/01/Gustav-Fransson6.jpg" show_in_lightbox="off" url_new_window="off" use_overlay="off" always_center_on_mobile="on" force_fullwidth="off" show_bottom_space="on" custom_margin="||21px|" disabled_on="on|on|on" disabled="on" /][et_pb_text admin_label="Namn och title" _builder_version="3.0.89" background_layout="light" module_class="gen-single-ingress-module" custom_margin="||40px|" disabled_on="on|on|on" disabled="on"]
Gustav Fransson
Portfolio Manager of Coeli Nordic Corporate Bond Fund
[/et_pb_text][et_pb_image _builder_version="3.0.89" src="https://coeli.com/wp-content/uploads/2018/10/Alexander-Larsson-Vahlman.jpg" show_in_lightbox="off" url_new_window="off" use_overlay="off" always_center_on_mobile="on" force_fullwidth="off" show_bottom_space="on" custom_margin="||21px|" disabled_on="on|on|on" disabled="on" /][et_pb_text admin_label="Namn och title" _builder_version="3.0.89" background_layout="light" module_class="gen-single-ingress-module" custom_margin="||40px|" disabled_on="on|on|on" disabled="on"]
Alexander Wahlman
Senior Analyst
[/et_pb_text][et_pb_text admin_label="Fund Overview" _builder_version="3.0.89" background_layout="light" custom_margin="||20px|" module_class="gen-trustee-single-table"]
Fund Overview
| Inception Date | 2017-12-20 |
| Investment management fee (share class I SEK) | 1.00% p.a + 20% Performance fee (OMRX T-Bill Index) |
| Performance Fee. Yes | 20% |
| Risk category | 5 of 7 |
[/et_pb_text][et_pb_text admin_label="Top Holdings (%)" _builder_version="3.0.89" background_layout="light" custom_margin="||20px|" module_class="gen-trustee-single-table" disabled_on="on|on|on" disabled="on"]
Top Holdings (%)
| LANSBK 1.25% 18-17.09.25 | 4.1% |
| NORDEA HYP 1.0% 19-17.09.25 | 4.1% |
| SWEDBK 1.0% 19-18.06.25 | 4.1% |
| WHITE MOUNT FRN 17-22.09.47 | 3.9% |
| B2 HOLDING FRN 19-28.05.24 | 2.9% |
[/et_pb_text][/et_pb_column][/et_pb_row][/et_pb_section][et_pb_section bb_built="1" fullwidth="off" specialty="off" _builder_version="3.0.89" module_class="gen-trustee-single-yield-section gen-pattern-section" custom_padding="0px|||"][et_pb_row _builder_version="3.0.89" custom_padding="||53px|"][et_pb_column type="4_4"][et_pb_text admin_label="VIKTIG INFORMATION" _builder_version="3.0.89" background_layout="light" module_class="gen-trustee-single-warning-blurb"]
IMPORTANT INFORMATION. This is a marketing communication.
Before making any final investment decisions, please refer to the prospectus of Coeli SICAV II, its Annual Report, and the KID of the relevant Sub-Fund. Relevant information documents are available in English at coeli.com. A summary of investor rights will be available at
https://coeli.com/regulatory-information-coeli-asset-management-ab/.
Past performance is not a guarantee of future returns. The price of the investment may go up or down and an investor may not get back the amount originally invested.
[/et_pb_text][/et_pb_column][/et_pb_row][/et_pb_section]