[et_pb_section bb_built="1" fullwidth="off" specialty="off" _builder_version="3.0.89" background_image="https://coeli.com/wp-content/uploads//2018/08/malmo-bro-comp.jpg" parallax="on" module_class="gen-trustee-single-hero"][et_pb_row][et_pb_column type="4_4"][/et_pb_column][/et_pb_row][/et_pb_section][et_pb_section bb_built="1" fullwidth="off" specialty="off" _builder_version="3.0.89" custom_padding="0px||0px|"][et_pb_row][et_pb_column type="4_4"][/et_pb_column][/et_pb_row][et_pb_row _builder_version="3.0.89" background_position="top_left" background_repeat="repeat" background_size="initial" custom_padding="0px|||" custom_padding_phone="23px|||" custom_padding_last_edited="on|tablet" module_class_2="gen-trustee-single-sidebar" module_class="gen-single-news-content-row "][et_pb_column type="4_4"][et_pb_text admin_label="Tillbaka-knapp" _builder_version="3.0.89" background_layout="light" border_style="solid" custom_margin_tablet="||17px|" custom_margin_last_edited="on|desktop" module_class="gen-back-button hide-in-print" border_style_all="solid"]
Note that the information below describes the share class (I SEK), which is a share class reserved for institutional investors. Investments in other share classes generally have other conditions regarding, among other things, fees, which affects the share class' return. The information below regarding returns therefore differs from the returns in other share classes.
Before making any final investment decisions, please read the prospectus, its Annual Report, and the KID of the relevant Sub-Fund here
[/et_pb_text][et_pb_text admin_label="Tillbaka-knapp" _builder_version="3.0.89" background_layout="light" border_style="solid" custom_margin_tablet="||17px|" custom_margin_last_edited="on|desktop" module_class="gen-back-button hide-in-print" border_style_all="solid"]
This material is marketing communication
[/et_pb_text][et_pb_text admin_label="Datum / Skriv ut" _builder_version="3.0.89" background_layout="light" border_style="solid" custom_margin_tablet="||17px|" custom_margin_last_edited="on|desktop" module_class="gen-single-news-date-module gen-trustee-print-module hide-in-print" locked="on" border_style_all="solid"]
[blog_post_date]
Print
[/et_pb_text][et_pb_text _builder_version="3.0.89" background_layout="light"]
Monthly Newsletter Coeli European – October 2023
OCTOBER PERFORMANCE
The fund’s value decreased by 1.6% in October (share class I SEK) while the benchmark decreased by 3% for the same month, measured in SEK.
 *Adjusted for spin-off of Rejuveron.** AEE: Absolute European Equity, CE: Coeli European, Benchmark: MSCI Europe SMID Cap Net Total Return SEK.Please Note: On the 4th of September 2023, the strategy of the fund officially changed from a European long biased equity long/short fund to a European active long only fund. Simultaneously, the name changed from Coeli Absolute European Equity to Coeli European. The track record highlighted in colour in the table above is that of Coeli Absolute European Equity.
EQUITY MARKETS / MACRO ENVIRONMENT
October was an unusually intense month that was dominated by Hamas's vile attack on innocent Israelis leading to a new and ongoing war, by continued rising interest rates and by a slew of company reports. The first two events contributed to a negative climate in the world's stock markets, and companies with quarterly reports that were below expectations saw their share prices come under significant pressure. It took extraordinary reports for share prices to rise. So far into the reporting season, the price movements on weak reports have been the biggest since the third quarter of 2008! Having said that, we were pleased to see that the fund's reporting companies have fared very well and we are satisfied with the fund's performance in November in a challenging environment. There are still a number of important reports for our companies in November.
Measured in local currency, the broad European stock market fell in October by 3.7%, while European small and medium-sized companies fell by 6.0%. The S&P500 and Nasdaq fell by 2.3 and 2.8%, respectively. In Sweden, the OMX fell by 3.7% and the Carnegie Small Cap index by 3.2%. The fund value measured in Swedish kronor fell by 1.6%.
October was a weak month and up until October 27th, the Eurostoxx50 had fallen for six weeks in a row, which has only happened three times in the last 25 years (1998, 2008 and 2011). SBX, Stockholm's broad index, was down 10 out of 11 days from mid-October, which is extremely unusual. That investors are record depressed is no exaggeration and therefore we also see share prices that, on the contrary, are priced at unusually attractive levels for those who can persevere to own shares over a slightly longer period of time. Here we are mainly referring to small and medium-sized companies, which by Swedish standards are companies with a market capitalization of up to SEK 100 billion.
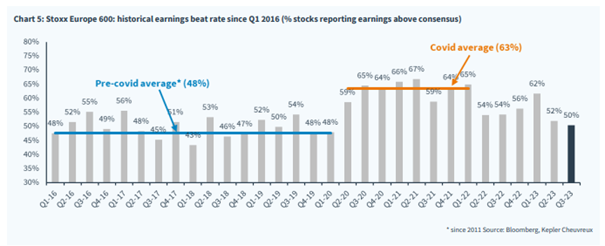
The proportion of companies that beat market expectations has been falling during the first three quarters of the year. The third quarter is still looking good with 50%of the companies surprising on the upside. However, future prospects have become somewhat clouded.
 Source: Kepler Cheuvreux
Investor sentiment has been and continues to be at very low levels. It can always get worse, but it is often a good contraindication when the sentiment indicator looks like the one below. At the end even the last seller in the market will have finished selling.
 Source: Goldman Sachs
If we zoom out and ignore the tragic geopolitical development, then the single biggest explanatory factor for how the stock market developed during the autumn is the continued and rapidly rising interest rates. Only three months ago, expectations were that the US economy would have a modest GDP growth of 0.5% for the third quarter. On Thursday, October 26th, the result came and it was almost 10x higher at 4.9%. A real failing mark for all the world's forecasters and fantastically impressive for the world's largest economy. This in an economy where two-thirds is made up of private consumption. It has also succeeded in creating 2.8 million new jobs. Hat off.
For the stock market, the battle between recession and soft landing continues and whether the highest levels in the interest rate market are behind us. Formerly strong historical connections work worse in today's complex world. It is also the reason why investors have an unusually short investment horizon where they wait for the outcome in each situation.
Those who invest capital coldly count on an economic soft landing. Cyclical companies have developed significantly better than defensive companies in the last six months.
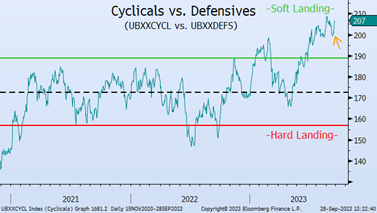 Source: UBS
The talk of The three Big Bills in October: The first is the US Treasury bill, T-bills. The other is Bill Ackman, successful hedge fund manager, who tweeted that they were closing their short position in US Treasuries, causing interest rates to drop significantly from their highs.
 Source: X
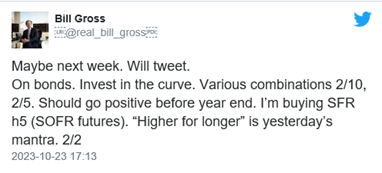
The third is Bill Gross, legendary bond manager who tweeted that higher for longer is yesterday's mantra.
 Source: X
The recent sharp rise in the US 10-year yield is equivalent to a 75 basis point hike by the Fed. Jerome Powell admits that the US budget deficit and the FED's QT have contributed to the rise in interest rates, which in practice means that the FED has to some extent lost control over its policy. Now it is the bond market that dictates the conditions and if interest rates do not fall in the coming months, the risk of a recession increases, even in the world's most powerful economy. Hence Bill Gross's comment above, central banks are closer to interest rate cuts than they communicate. Maybe we'll see a break in QT soon? Incidentally, inflation is old news in the financial market and the decline will likely continue in the coming months.
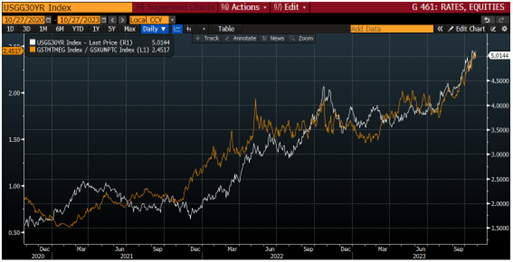
Below shows that the yield curve will soon turn positive, that is, the 10-year interest rate exceeds the 2-year interest rate, which is more of a normal situation and what Bill Gross believes will happen before the end of the year. The difference now compared to how it usually is, is that the central banks have a policy which says that interest rates should be at high levels for a long time to come and that, all else being equal, will affect the economy negatively, which in turn is negative for stocks. The big question is therefore, how much should the earnings estimate go down before we turn back up? Soft landing or recession?
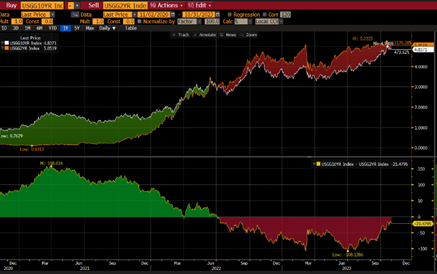 Source: Bloomberg
Below illustrates how earnings per share typically move when 1) the Fed raises rates 2) leaves interest rates unchanged and 3) lowers interest rates.
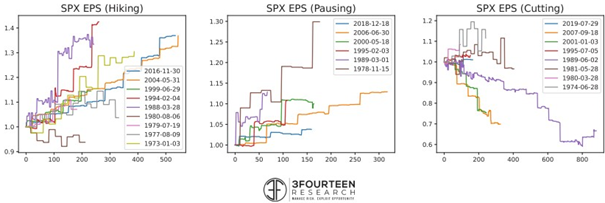 Source: 3FOURTEEN RESEARCH
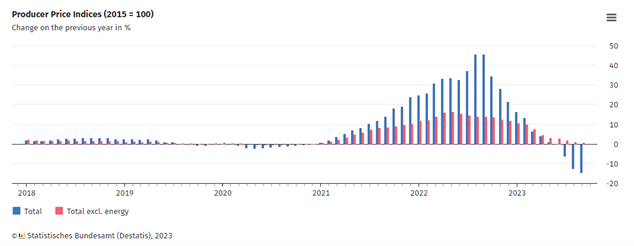
The latest data on German producer prices shows a decline of 15%! The corresponding figure excluding energy was around zero.
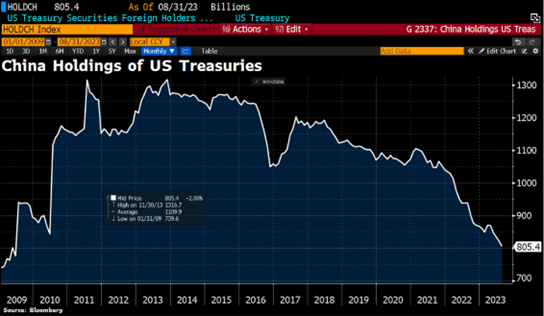
Who will finance the US budget deficit going forward? The figure below shows the Chinese government's holdings of US Treasuries. There is likely some depreciation included in the graph below, but clearly appetite has diminished. There is probably a political element here as well, as the relationship between China and the US is frostier than it has been for a long time. Coincidentally, we hear that preparation is underway for a meeting between Joe Biden and Xi Jinping later in November.
 Source: Bloomberg, Holger Holger Zschaepitz
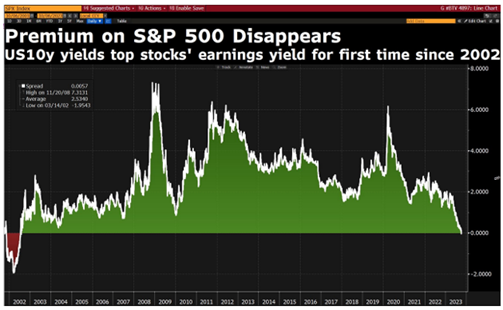
The high interest rate sucks capital out of the stock markets. For the first time since 2002, the earnings yield on US stocks is lower than the US 10-year yield. In Europe, however, the picture is completely different with significantly lower interest rates and valuations.
 Source: Bloomberg, X
There are some glimmers of light even if you have to put in a little effort. The German IFO index shows a slight increase at the latest reading, but is still at low levels.
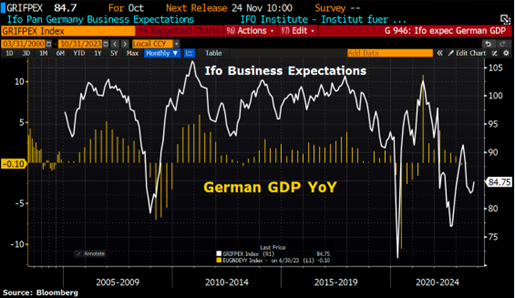 Source: Bloomberg, Holger Holger Zschaepitz
We note that the Greek interest rate is now lower than the American one. Spontaneously, one would think that as a bond investor you would want to be paid more for owning Greek government bonds than US ones.
 Source: Bloomberg, Holger Holger Zschaepitz
The white line below is the US 30-year. The orange line is the relationship between the big tech companies and a basket of unprofitable tech companies. The point is crystal clear, the large companies with extremely strong balance sheets are considered a safe haven despite rising interest rates, while unprofitable company shares are hit hard.
 Source: Goldman Sachs, Bloomberg
The image below illustrates the share prices of the seven major tech companies (BT7) which have been almost completely decoupled from the rising interest rate. The yellow line shows BT7's price development and the white the inverted US long-term yield.
The breadth of the market (the percentage of companies trading above their 200-day moving average) is again, just like in September 2022 when the market bottomed, at an all-time low. It is a risk that one must be observant of, and this reporting season, BT7's reports have not led to any major price movements upwards, rather the opposite.
Only twice has the concentration of the most valuable companies been as great as today, and that was in July 1932 and November 2000. In the defence of the big tech companies, the expectations for the third quarter were a profit growth of around 33%. The other 493 companies in the S&P500 were expected to have earnings growth of a more modest 8.6% (source Bernstein).
 Source: Bloomberg, Kepler Cheuvreux
New home loan applications in the US are down 50% since the start of the year and are now at their lowest level since 1994. Even lower than during the financial crisis! The mortgage interest rate in the US is now over 8%, but all of 90% of those with mortgages have locked in the interest rates at significantly lower levels. Since statistics began to be kept, there has never been a worse time for private individuals to buy a home than now. At the same time, the rest of the economy is picking up steam thus indicating that these are unusual times.
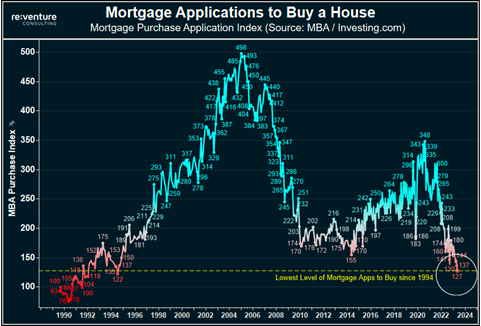 Source: Reventure Consulting, X
It was a feeling of unease when Hungary's Prime Minister Viktor Orbán shook hands with the war criminal Putin during a visit to China in mid-October. The meeting took place in connection with the leaders of China, Russia and Hungary celebrating the tenth anniversary of the Chinese New Silk Road project. Orbán and Putin are said to have discussed bilateral cooperation in nuclear power, natural gas and crude oil. It is, to say the least, remarkable and quite bizarre that Hungary, which is a member of both the EU and NATO, has for a long time acted as an effective brake on Sweden's membership in NATO, probably eagerly encouraged by Putin.
 Source: Associated Press
It shall not be easy. Microsoft’s share has had 10 times stronger price development than Philip Morris's over the past 10 years. Both had a growth in cash flow of 170%. Microsoft's earnings multiple increased from 9x to 40x, while Philip Morris fell from 17x to 8x. The bottom line is that there are only two things that drive a stock price over time - the company's ability to create value and the valuation when you make your investment. That's why we spend all our time on fundamental analysis.
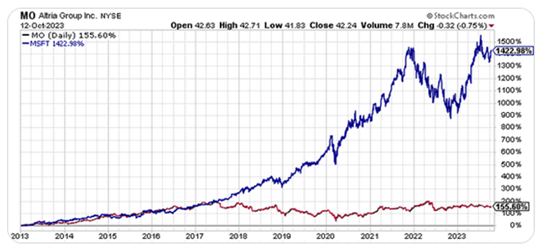 Source: KochBank, X
Again, it shall not be easy.
 Source: X
PORTFOLIO COMPANIES
Bonesupport
During the month, Bonesupport delivered another brilliant report in the damp autumn weather. The company's sales were 8% better than the high expectations and a whopping 41% better operating profit. With a gross margin of over 90%, it is the leverage in the business model that really started to show its colours. The stock market rewarded the share with a rise of 21% on the day of the report and this year has risen by a whopping 86% (the fund's best share this year).
It is now exactly 1 year since the company launched Cerament G in the USA. The product's run-rate sales per Q3 now stand at 251 million, an unparalleled feat in such a short time. What the market especially noticed during the report day (we think) was that the company mentioned that it now has access to 1,000 hospitals in the US but only 200 of these have ordered at least one package of Cerament G. We wrote about the penetration in our July newsletter in connection with their Q2 report. However, it seems that the elevator now went all the way up for analysts and that there is a very long duration in the deal.
The company has also set a date for a capital market day at the end of November. Now the company has positive cash flow and with little investment required, Bonesupport will quickly become a cash flow machine with cash EBIT margins between 40 and 50%. The Capital Markets Day will likely give more colour on what this money should be used for.
We believe that "Spine" is one of the indications that Bonesupport will touch upon as their next step in the growth journey (despite Cerament G just starting its journey). The market estimates that "Spine" has an addressable market that is four times larger than the one Bonesupport is approved for today.
Our view is that the market values Bonesupport based on known facts and does not price in new products. We see at least 30-40% upside in Bonesupport over the next two years and we take our hats off to CEO, Emil Billbäck, and CFO, Håkan Johansson, as well as the rest of the team at Bonesupport. The risk of a takeover has undoubtedly increased after another phenomenal report.
The image below shows the development of the operating profit on a quarterly basis for Bonesupport and it is unusual to see such a clear inflection point for a company where profits suddenly shoot off.
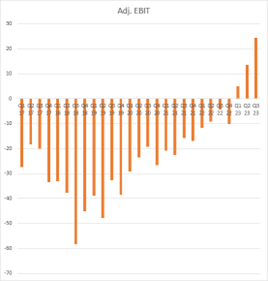 Source: Bonesupport, Coeli EuropeanSLP
SLP delivered one of the strongest quarterly reports we have seen in a long time. The profit from property management came in 16% above expectations, which is a lot for a real estate company. The operating net grew by as much as 50% compared to the previous year. What impressed the most was that the net asset value, despite a return requirement that rose by 30 basis points, increased by 10% this year. It is improbably strong, and we are slowly starting to think about what will happen on the day the yield requirement starts to be lowered again, which should not be too far off in the future.
It is clear that SLP is a winner when other real estate companies have concerns. We believe they are in a very strong position and have the balance sheet to buy properties at levels not thought possible 12-18 months ago. If we do a simple calculation exercise and assume a growth in the operating net of 10% per year for the next two years and that the required rate of return drops from 5.9% to 5.0%, property values rise by approximately 3.5 billion or approximately SEK 17 per share everything else equal (the share costs SEK 26 today). We continue to sit tight and wait for future returns.
Cargotec
Finnish Cargotec delivered an undramatic Q3 report. The company had a pre-silent call a few weeks earlier, which we believe provided many answers to analysts' questions. The operating profit came in 14% better than expected, but all the focus is on the order intake for industrial companies and in Cargotec's case it was in line with expectations. The company also announced cost savings to meet the uncertain situation and has been very clear that it must defend a 10% operating margin within the group. There are a number of clear triggers in Cargotec over the next two years linked to the spin-off of Kalmar and HIAB and a sale of MacGregor.
The company trades at a very low 6x and 10x P/E ratios for the current year and 2024. That is extremely low for a, basically, unleveraged quality company. Kalmar and HIAB belong to the top Nordic industry leaders in terms of sales growth and return on capital. If the company delivers on its plan to sell MacGregor next year, upwards of 500 million euros would flow in while profits would not change significantly. The adjusted P/E ratio is then 5x and 8x. It's almost unbelievable.
The low valuation constitutes a large cushion should the economy deteriorate. It also gives a big upside if the outcome beats the estimate next year. We easily see a 50% upside in the relatively short term in connection with spinning out Kalmar and HIAB.
Corem
Corem's report was undramatic with a management result that came in line with expectations. The positive thing is that the company continues to have positive net lettings, which indicates that the underlying business is healthy.
Something that was very gratifying and that caused the share to rise by 23% in October was that they signed letters of intent to sell properties for an additional SEK 12 billion. Of these, 1.2 billion have now been implemented. Our hope is that the Copenhagen portfolio is included in this 12 billion. It would have a positive impact on the company's cash flow as these properties are low yielding and instead you can buy back expensive bonds.
Corem is a play on the underlying real estate market and the company's ability to restructure. So far, they have sold and entered into letters of intent for close to 25 billion in one year. As long as the discount is around 70%, it's just a matter of continuing to sell, even if it requires some write-downs. You can simplify it and say if you sell for 12 billion and have loans for 6 billion, 6 billion is released. That cash should reasonably not be traded at a 70% discount but at a zero percent discount. In this example, that would remove 4 billion in discount, which is about 40% of today's market capitalisation. All simplified of course, but you see the point. With enough selling, and we don't think it's that far off, you could then start buying back shares which would have been extremely valuable at these levels.
Lindab
Over the years, we have been spoiled with good reports from Lindab. The Q3 report that came in October was no exception. The company's operating profit of SEK 351 million exceeded expectations by almost 20%. Despite lower volumes, Lindab has managed to defend margins in a good way with the help of cost programmes, completed capital investments and an improved inventory situation. In addition, the cash flow was strong, which is favorable for the next stage in the Lindab story: acquisitions.
When we invested in Lindab for the first time in 2019, the investment thesis was very much about CEO, Ola Ringdahl, succeeding in transforming the business structurally and via organic investments to increase profitability. Today, the major changes have been completed and the company is more forward-looking and focused on growth. In the Q3 report, an ambition to reach SEK 20 billion in turnover in 2027 was announced, to be compared with the 12-month rolling turnover of SEK 13 billion. Most of that growth will be acquired.
We recognize the acquisition strategy from other successful acquisition companies. Lindab wants to buy well-managed companies at a reasonable valuation, preferably with management retained and with a high degree of autonomy. Ideally, you make many, but slightly smaller acquisitions to reduce the risks. Since 2020, it has acquired more than twenty companies, and many more will be needed in order for Lindab to reach its turnover target in 2027. Despite the fact that Lindab wants to maintain a decentralized structure, there are clear synergies in, above all, purchasing. In the conference call, it was said, for example, that they had succeeded in raising profitability from 4–5 to 7–8 percent for Felderer, a German distributor business that was acquired in 2022.
As we value the company, the share is currently traded at around 10x operating profit in 2025. Such a valuation naturally reflects that the market is uncertain about the construction industry (and a higher interest rate situation). At the same time, we think it is too low for a Lindab that is becoming a better company year by year, and which should be able to take market shares in a tough climate. In the longer term, Lindab could be awarded a serial acquirer multiple and the latest report had a quality that for us was a clear step in that direction. The stock rose by 7% in October.
Volution
During the year, we bought shares in British Volution. The company sells ventilation equipment with a focus on housing. The housing focus has of course raised some question marks in relation to headlines about the every day situation, but in October Volution released its report for the broken financial year which ends at the end of July. Despite the circumstances, organic growth was 5%. The operating margin landed at just over 21%. The market liked what it saw and Volution rose 8% on the day of the report.
The company has good protection against the construction industry for several reasons: first, the proportion of revenue that comes from renovation is high, and second, more and more regulations (both at the EU level and for individual countries) provide a strong tailwind in sales. Many of Volution's products help customers improve energy efficiency/save money, which is of course desirable when consumers' wallets are getting thinner. We ask ourselves the question: How much should Volution grow when the construction industry turns? Clearly higher than 5%, we think. The stock trades at single-digit earnings multiples (in terms of operating profit), which we think is far too low.
LVMH
LVMH was the only report in October that did not meet our and the market's expectations. Organic growth came in at 9% against the expected 11%. The market has been spoiled for a long time with very strong reports, but this led to estimates being subsequently lowered by a few percent. As usual, the share reacted more than that and on the day of the report the share fell by 6.5%. When the rest of the stock market came under renewed pressure in the second half of October, however, the LVMH share held up well. We have maintained our position as we believe that around 20x in P/E ratio for 2024e is clearly attractive for one of the world's best companies.
Biotage
Biotage is a relatively new company that we started buying into during the summer with a small observational position, as we thought that the stock had come down a lot while there were some technical factors surrounding a larger acquisition. The stock continued to fall and as our knowledge of the company increased we bought more stock.
It is a global company headquartered in Uppsala , Sweden, that provides solutions for more efficient drug development (65% of sales), analytical testing (27% of sales) and water and environmental analysis (8% of sales). The company specializes in innovative separation and purification solutions. The company develops and supplies instruments, consumables and expertise to facilitate the purification and analysis of complex molecules. Today, the development of synthetic drugs is the largest division (white pills), but with the acquisition of Astrea (in May), the company expanded towards biopharmaceuticals. We will return to this.
Biotage is undoubtedly a quality company within its niche. The company has eighteen of the twenty largest pharmaceutical companies as its customers. In the last 10 years, it has had a turnover growth of an average of 14.5% per year, of which 6.6% organically. During the same period, EBIT has grown by 22% annually. In the period before Covid-19, organic growth amounted to 8.6% annually.
The company has a history of making smaller bolt-on acquisitions. In principle, one hundred percent of their sales are direct to customers. It is expensive and takes time to build such a sales organization and infrastructure, but once in place it is very effective in selling new products or integrating new products from acquisitions. The effect over time can be seen in the growth of the operating profit. This means that Biotage has a ROCE of 25% on average over the past five years. If we adjust for goodwill, ROCE averages around 41%, which should be a better benchmark given where the company stands and is going. It is thus a company that has created and continues to create significant shareholder value.
In May, Biotage acquired Astrea Bioseparations. Simplistically, you can say that Astrea does the same thing as Biotage in biopharmaceuticals. The seller of Astrea was a KKR-backed fund and the interesting thing about the deal is that they paid 100% with shares (at a price of 160) and that Astrea went in and took two board seats in Biotage. From what we understand, the companies have been discussing the deal for 5-6 years before it took place thus indicating that the companies are more intertwined than one might first think.
What’s the outcome of this deal then? Astrea gets access to Biotage's infrastructure, which has been built over several years. Biotage gets access to a market that is growing faster than the one it is active in today. Biological medicines are expected to grow by over twenty percent per year for the next ten years. Astrea has a very high percentage of recurring sales, which takes the group to 65% recurring sales per Q3.
In the past year, diagnostic and pharmaceutical companies have had the most challenging environment in twenty years. The hangover from doped Covid years was painfully reminded this year. The development of Covid related products and cheap financing meant that several of these companies were under high pressure in 2021/2022. It is only this year that we see a normalization. As far as we know, there is not a single company out there that has not profit warned or been guided down in the sector. To quote Bio Rad's conference call "a biopharma meltdown". This has put pressure on the companies' profits but also on the multiples.
Our initial thesis was that the market would bottom out in Q3 and that peak fear would hit around the report. We can confidently state that we were almost right. Adjusted EBITA came in 12% better than expected and the stock rose 17% on the day of the report. Astrea has grown 38% YTD, which is impressive given that the rest of the sector had and has negative growth. Organically, turnover decreased by 9%, but the company was positive about the future and said that instrument sales are starting to look brighter. Biotage faces simpler comparative numbers already in Q4, when it had -1% in organic growth, only to gradually become even simpler in 2024. Both Sartorius and Repligen (closest peer to Astrea) mention that orders probably bottomed out in Q3 and signs that it accelerated towards the end of the quarter.
To sum up, we think that Biotage has become a better company with the acquisition of Astrea. Higher growth, better margins, higher return on capital and more recurring revenue. All this at a lower valuation than what the company has been traded at historically. As the company has grown sales faster than the sector, it has historically been valued at a premium, but now it is at a roughly 30% discount. We see significant upside from here (50-60% in 12 months) and believe the stock will gradually re-enter the spotlight.
SUMMARY
October offered unwanted and tragic events which pressed down the risk appetite with lethargic trading as a result. 2023 is the worst year in Europe since 2014 in terms of trading volumes on the various stock exchanges. In the UK, volumes so far are the lowest since 2004! Completely unimaginable actually and something we also notice when we have to make adjustments in the portfolio.
Geopolitics often have less significance for the stock market than one might think. Regional wars, nasty as they may be, do not tend to upset the global economic cycle. The concern about an escalation has tightened the bow firmly downwards and a basiccondition for a more positive end to the stock market year is that the war does not escalate.
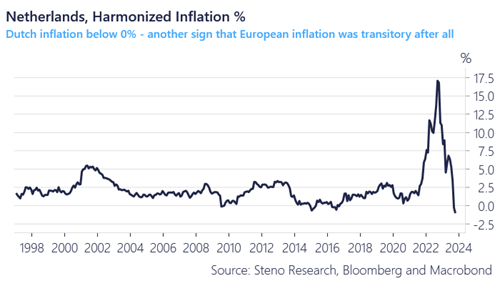
Significantly more positive is that inflation continues to fall at a rapid pace. On October 30th, we got Spanish and German inflation that was significantly lower than expected (m/m 0.3% in Spain and -0.2% in Germany). The Netherlands reported a few days ago that annual inflation is -1%! The ECB kept its key interest rate unchanged in October and we still believe that they will start lowering significantly earlier than communicated (Q1?). The downside of this is of course an economy that is slowing down.
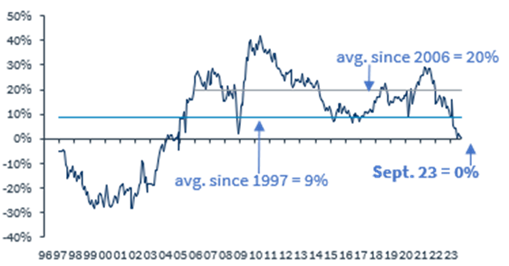
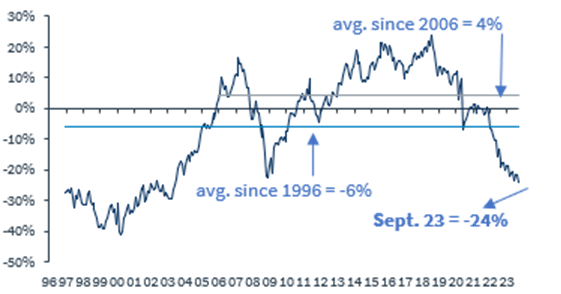
The larger companies continued to do better than smaller companies until the last days of October when it turned around in favour of smaller companies. It remains to be seen if that was the turning point, but in general you can say that the bigger the company, the better the return and the difference is now at record high levels. We are convinced that the smaller companies will get revenge, but it is unclear when the turning point will occur. The facts are that the differences are record-breaking, that smaller companies are early in the stock market cycle and are the most sensitive to a rising interest rate (and vice versa). Below is the relative development of smaller companies against larger companies since 1995. As of October 30, a new record was broken with -25% since the peak.
 Source: Kepler Cheuvreux
Below is the development on the Stockholm Stock Exchange during the year. The bigger the better the return. During August-September, when the American interest rate began to rise sharply, the development diverged significantly. The curves are likely to reverse in the next year (our view).
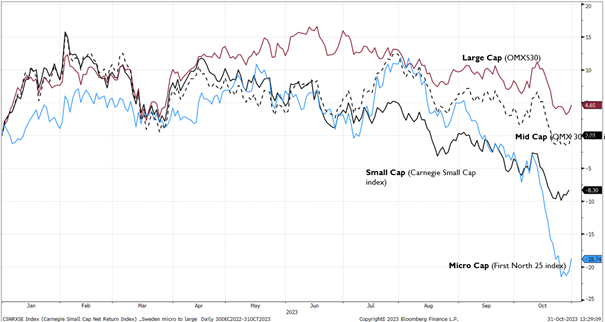 Source: Carnegie, Bloomberg
The excellent compilation below shows how smaller companies develop in times of rising and falling inflation. The numbers speak for themselves and inflation is, as you know, on the way down at a rapid pace.
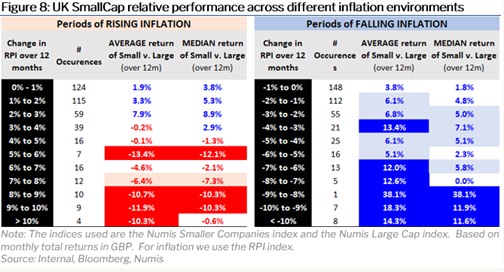 Source: Montanaro, Bloomberg, Numis
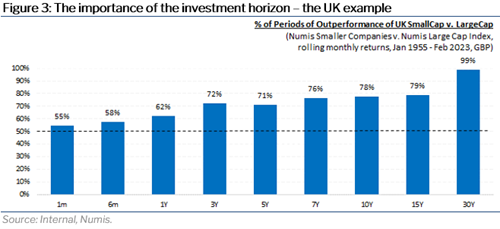
It all depends on what time horizon you have. A survey by the London Business School showed that between 1954-2022, British smaller companies developed 3.1% better than larger companies per year. This means a difference in the return over the period which was 7 times greater for the smaller companies and this is of course the reason why the asset class is so interesting, especially now after two years of very weak relative returns.
Another telling picture.
 Source: Montanaro, Numis
The greater the valuation difference, the stronger the return over the next 12 months. According to this we should be well positioned given the starting point today.
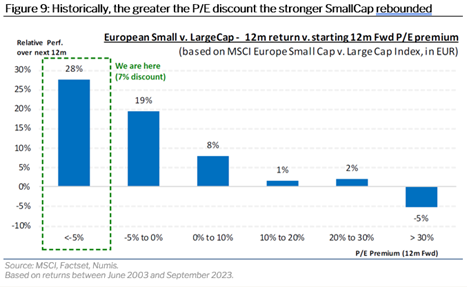 Source: Montanaro, MSCI, Factset, Numis
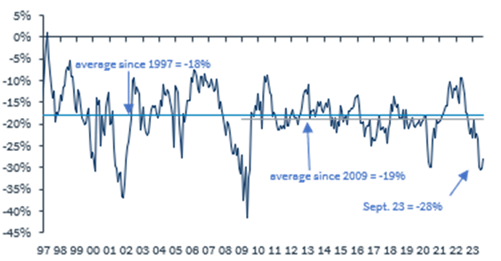
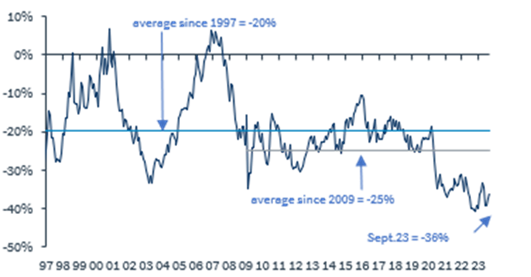
The images below show the valuation difference between European small and medium-sized companies compared to large companies since 1996. Relative P/E on the left and relative P/B on the right. We are at historically low levels.
 Source: Kepler Cheuvreux
Below is shown the difference in valuation between European and American small and medium-sized companies. Relative P/E on the left and relative P/B on the right. Here, too, we are at historically low levels.
 Source: Kepler Cheuvreux
The valuation difference between Europe and the USA is probably the reason why American investors have sold American stocks since last summer and increased their exposure in Europe.
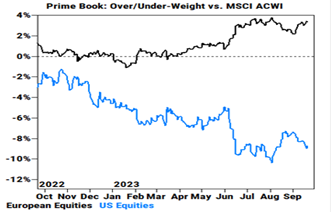 Source: Goldman Sachs
Berenberg has compiled the image below showing the Z-score for the German stock market. Z-score is a combination of P/E ratio, dividend yield and P/B. When the Z-score is below -1 (now -1.5), the German stock market has historically risen by 22% in the following 12 months and with almost 100% accuracy.
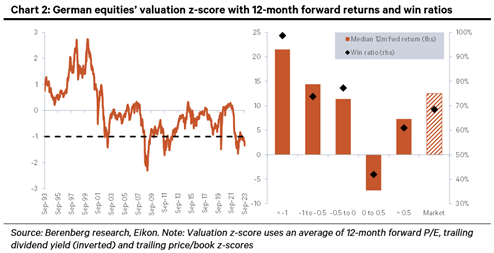 Source: Berenberg
The last picture for this time shows the seasonal variation in the yield. There is no law of nature that says the return will be positive, but the seasonal effect over the long term is clear.
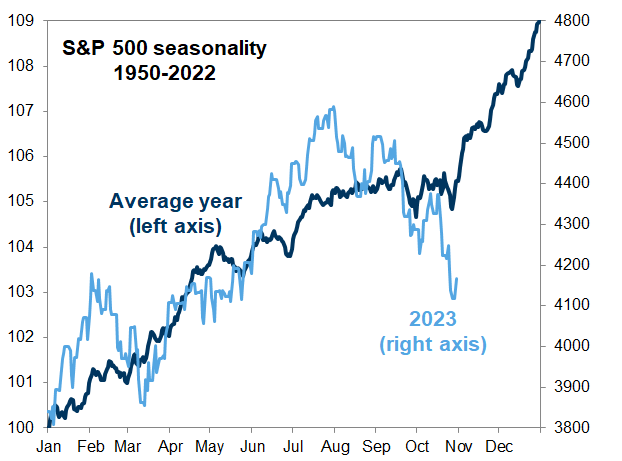 Source: Goldman Sachs
In summary, our market view a month ago was that we expected a positive return for the fourth quarter, which we maintain. We did not expect October to be so weak, but the Hamas attack and its consequences changed some of the conditions. The single greatest risk now in our view is if the war between Israel and Hamas escalates.
There are some signs that stock markets have began a recovery, and especially within the asset class small and medium-sized companies.
• In the last days of October, the indices for small and medium-sized companies developed a couple of percentage points better than broad indices. It had been a while since that happened.
• The reporting period is largely over and volatility from the reporting period is likely to decrease (predominantly negative volatility in October).
• The US 10-year yield has turned down a few times from the high of five percent as bond buyers have come in. If it breaks through five percent tough, it will be strained for a while.
• The sentiment among investors is downright depressed.
• The positioning in the market is not rigged for an upswing and many are sitting on a large cash register.
• The buybacks start rolling and November/December are the months with the largest volumes in terms of share buybacks.
• Most broad indices are down three months in a row. That is unusual.
• Most funds have had an outflow, and above all small company funds. At some point it will end.
• Many stocks are well oversold and largely due to large outflows.
When we then look into 2024, it's all about how much the profits will decrease, but we'll come back to that!
Thanks for your interest.
Mikael & Team
Malmö, November 6th, 2023
[/et_pb_text][et_pb_post_title _builder_version="3.0.89" title="on" meta="off" author="off" date="off" categories="off" comments="off" featured_image="off" featured_placement="below" text_color="dark" text_background="off" border_style="solid" module_class="gen-single-news-heading-module gen-trustee-single-headline" date_format="d M, Y" border_style_all="solid" disabled_on="on|on|on" disabled="on" /][et_pb_text admin_label="Coeli Nordic Corporate Bond Fund R-SEK" _builder_version="3.0.89" background_layout="light" module_class="gen-table-module" disabled_on="on|on|on" disabled="on"]
Coeli Nordic Corporate Bond Fund
| Performance in Share Class Currency | 1 Mth | YTD | 3 yrs | Since incep |
| Coeli Nordic Corporate Bond Fund - R SEK | 1.30% | -0.93% | 3.38% | 14.52% |
| | | | |
[/et_pb_text][et_pb_text admin_label="Coeli Nordic Corporate Bond Fund R-SEK" _builder_version="3.0.89" background_layout="light" module_class="gen-table-module" disabled_on="on|on|on" disabled="on"]
[cg_linear_graph id="31122"]
[/et_pb_text][et_pb_image _builder_version="3.0.89" src="https://coeli.com/wp-content/uploads//2020/10/ncbr.png" show_in_lightbox="off" url_new_window="off" use_overlay="off" always_center_on_mobile="on" force_fullwidth="off" show_bottom_space="on" disabled_on="on|on|on" disabled="on" /][et_pb_image _builder_version="3.0.89" src="https://coeli.com/wp-content/uploads/2019/01/Gustav-Fransson6.jpg" show_in_lightbox="off" url_new_window="off" use_overlay="off" always_center_on_mobile="on" force_fullwidth="off" show_bottom_space="on" custom_margin="||21px|" disabled_on="on|on|on" disabled="on" /][et_pb_text admin_label="Namn och title" _builder_version="3.0.89" background_layout="light" module_class="gen-single-ingress-module" custom_margin="||40px|" disabled_on="on|on|on" disabled="on"]
Gustav Fransson
Portfolio Manager of Coeli Nordic Corporate Bond Fund
[/et_pb_text][et_pb_image _builder_version="3.0.89" src="https://coeli.com/wp-content/uploads/2018/10/Alexander-Larsson-Vahlman.jpg" show_in_lightbox="off" url_new_window="off" use_overlay="off" always_center_on_mobile="on" force_fullwidth="off" show_bottom_space="on" custom_margin="||21px|" disabled_on="on|on|on" disabled="on" /][et_pb_text admin_label="Namn och title" _builder_version="3.0.89" background_layout="light" module_class="gen-single-ingress-module" custom_margin="||40px|" disabled_on="on|on|on" disabled="on"]
Alexander Wahlman
Senior Analyst
[/et_pb_text][et_pb_text admin_label="Top Holdings (%)" _builder_version="3.0.89" background_layout="light" custom_margin="||20px|" module_class="gen-trustee-single-table" disabled_on="on|on|on" disabled="on"]
Top Holdings (%)
| LANSBK 1.25% 18-17.09.25 | 4.1% |
| NORDEA HYP 1.0% 19-17.09.25 | 4.1% |
| SWEDBK 1.0% 19-18.06.25 | 4.1% |
| WHITE MOUNT FRN 17-22.09.47 | 3.9% |
| B2 HOLDING FRN 19-28.05.24 | 2.9% |
[/et_pb_text][/et_pb_column][/et_pb_row][et_pb_row _builder_version="3.0.89" background_position="top_left" background_repeat="repeat" background_size="initial" module_class="gen-single-news-content-row gen-trustee-single-content-row" custom_padding="0px|||" custom_padding_phone="23px|||" custom_padding_last_edited="on|tablet" module_class_2="gen-trustee-single-sidebar" disabled_on="on|on|on" disabled="on"][et_pb_column type="2_3"][et_pb_text admin_label="Tillbaka-knapp" _builder_version="3.0.89" background_layout="light" border_style="solid" custom_margin_tablet="||17px|" custom_margin_last_edited="on|desktop" module_class="gen-back-button hide-in-print" border_style_all="solid"]
Note that the information below describes the share class (I SEK), which is a share class reserved for institutional investors. Investments in other share classes generally have other conditions regarding, among other things, fees, which affects the share class' return. The information below regarding returns therefore differs from the returns in other share classes.
Return to Fund page
[/et_pb_text][et_pb_text admin_label="Datum / Skriv ut" _builder_version="3.0.89" background_layout="light" border_style="solid" custom_margin_tablet="||17px|" custom_margin_last_edited="on|desktop" module_class="gen-single-news-date-module gen-trustee-print-module hide-in-print" locked="on" border_style_all="solid"]
[blog_post_date]
Print
[/et_pb_text][et_pb_post_title _builder_version="3.0.89" title="on" meta="off" author="off" date="off" categories="off" comments="off" featured_image="off" featured_placement="below" text_color="dark" text_background="off" border_style="solid" module_class="gen-single-news-heading-module gen-trustee-single-headline" date_format="d M, Y" border_style_all="solid" /][et_pb_text _builder_version="3.0.89" background_layout="light"]
Utveckling september
Fondens värde sjönk -5,1 procent i september (andelsklass I SEK). Stoxx600 (brett Europaindex) sjönk under samma period med -3,4 procent och HedgeNordics NHX Equities var preliminärt oförändrat. Motsvarande siffror för 2021 är en ökning om +21,6 procent för fonden, +14,0 procent för Stoxx600 och +6,4 procent för NHX Equities.


Equity markets / Macro environment
After seven consecutive months of positive performance the world’s stock markets were poised for some degree of turbulence. Volatility was especially high in some equities and on Monday, September 20, the highest nominal volume ever traded was reached in options on the S&P500 (!) The broad European index fell by 3.4 percent in September compared to the S&P500 which fell by 4.8 percent. The fund also had its first negative performance since October last year with a decline of 5,1 percent. More about that later.
Despite high levels for many stock indices, sentiment among investors has been relatively gloomy. Bank of America's monthly survey recently showed that only 13 percent of managers expect a positive market in the future, which is the lowest figure since April 2020 (and that was clearly wrong). The reasons cited are China's growth problems, the crisis-stricken Chinese real estate giant Evergrande, the development of the delta variant, declining profit growth and, of course, rising inflation. However, they are still overweight equities which is perhaps not so strange when you have to pay to lend your capital to countries. As interest rates rose at the end of the month, the German 10-year interest rate followed with a giant step from - 0.25 percent to - 0.17 percent… The picture below is an overall risk indicator, and we are around zero (neutral).

The news flow in September began with record high inflation figures in Europe at +3.0 which exceeded market expectations. The corresponding figure in July was + 2.2 percent. It was the fastest growth rate since November 2011 and several countries recorded up to five percent in inflation rate. The pressure on the ECB to reduce its support measures is increasing. On Friday, October 1, new inflation figures came in for September, which showed a further acceleration in the inflation rate by +3.4 per cent.
The rate of change can be mostly attributed to rising energy prices that are starting to create real problems in the world's economies as well as agricultural shifts. The picture below shows that food prices are at record high levels over the past 60 years. The biggest losers are the poorest part of the population.

In the slightly longer term it is forecasted that it is not excessive demand that will drive inflation, but rather a limited supply, and then both in terms of products and labour. At the end of September, long queues were reported at petrol stations across the UK when fuel ran out and there were not enough truck drivers to refuel. Prime Minister Boris Johnson urges his citizens to refuel sensibly and at a normal rate. You wanted Brexit, so there you go. In sheer desperation, Johnson has now issued 5,000 temporary short-term visas for temporary drivers. Good luck.
M25 spring 2022?

Below are European gas prices which have risen in a seemingly uncontrolled fashion and recorded the highest September prices ever. A silent prayer for the mild winter. We guess that this development will soon be a major topic in the media, and it will undoubtedly create various problems and somewhat reduce next year's expected growth. It feels reassuring that Per Bolund (Swedish Green Party MP) claims that there is no electricity shortage in Sweden because then the costs for ordinary people would be unbearably high during the winter (which of course they will be). Rising gas and electricity prices have led European politicians to start discussing billion-dollar subsidies (in euros) to households and manufacturers who will experience sharply rising electricity bills over the winter.

Source: Bloomberg
Henrik Svensson, site manager at the oil-fired power plant in Karlshamn (south Sweden), does not agree with Per Bolund that we have a surplus of electricity in the country. For large parts of September, the power plant ran at full capacity and burned 240k liters of oil per hour. Henrik Svensson believes that it is electricity shortages and high electricity prices that are behind the high production. He also says that there is a lack of planned power production in southern Sweden and that it will take many years before the electricity grid is strengthened and new electricity production is in place. Sweden today burns more oil than we have done in 10 years. A gigantic energy policy and climate policy failure signed by the Green Party.

Source: Steget efter
Winning candidate for this year's Christmas presents below.

The change in the US 10-year interest rate created considerable pressure on, primarily, growth stocks at the end of the month. The performance dispersion for different sectors was very large in September with oil shares as a clear winner. This was also felt in the last days of September.

Source: Bloomberg
Below is the development for the US 10-year interest rate. The turbulence in the stock market was caused by the change in interest rate level breaking through on the upside, as can be seen in the chart.

There have been countless attempts to explain the turbulence in recent weeks. The recent and significant amount of options being exercised, Evergrande, interventions by the Chinese government, Fed tapering, Bank of England expected to raise interest rates, delta variant, inflation, bottlenecks in production, difficulties in finding staff, rising energy prices and declining growth rates. We think it is enough to look at the picture below. Rising interest rates hit hard at growth companies' valuations.

Goodbye Mutti and thank you for an extraordinary effort for Europe!

Source: Nyhetsbyrån TT
She was politically in a class of her own during the euro crisis ten years ago and Sweden also has her to thank for a lot. Despite a somewhat weaker performance in recent years, German citizens have experienced significantly better economic development than many others.

On September 29, the covid-19 restrictions in Sweden were finally removed and we can now, in principle, start living a normal life again. The number of bookings for winter holidays skyrocketed to the great joy of the tourist and transport industry. In recent months, tourism activity in the Mediterranean has been "extraordinary" and much better than forecasted before the summer. Luxury travel is also reaching new heights. Private jet passengers to Mallorca increased by +70 percent in July compared to July 2019 with an average of 83 private jets per day landing in Palma. If you want to rent a yacht, you are being referred to next year as basically everything has already been fully booked.
We now belong to a minority group. Passively managed capital exceeds actively managed capital for the first time ever. This will give us more opportunities as mispricing increases.

In addition to being one of the world's best stock markets this year, Sweden also has the most listed companies in the entire EU. Bloomberg drew attention to the fact that there are now around 1,000 listed companies on the various trading platforms in Stockholm. More than 80 percent are smaller companies, and the list is filled with new listings every day until Christmas! For us, it is interesting as we are constantly looking for new potential core holdings. In recent weeks, we have identified one which we write about under Long Positions.
We end this section with a picture that well reflects today's political level.

Source: Kluddniklas
Long positions
Truecaller
During September, we did a lot of work on the Swedish company Truecaller which will go public on October 8th. Truecaller is one of the most interesting companies we’ve seen in recent years. Truecaller has developed a phone application that can, among other things, identify unwanted calls from, for example, telemarketers. The app is one of the top ten most downloaded applications globally, and in some of the main markets such as India, Nigeria and Indonesia, it is one of the three most downloaded apps. As a Swedish company with headquarters in Stockholm, the firm has chosen to list on the Swedish stock exchange, which we are very happy about.
Truecaller was founded in 2009 by Alan Mamedi and Nami Zarringhalam. They met at the Royal Technical University in Stockholm, and they continue to be active in the company as the CEO and Chief Strategic Officer (CSO), respectively. When they released the first version of the app, they received 10,000 downloads within one week. By 2013 they had reached over 10 million users globally and in Q2 2021 they had reached 278 million monthly users. Throughout their journey, Truecaller has attracted several well-known investors such as Sequoia Capital (early investors in Apple, Whatsapp, and Zoom among others), Atomica (Skype-founder Niklas Zennström’s investment company), and Kleiner Perkins (early investors in Google, Amazon, and Spotify among others).

Until recently, revenue streams have mainly consisted of income from in-app advertising. In addition to this, there is a premium version where paying users can get additional functionalities. That business accounted for around 20 percent of revenues in 2020. During the fall of 2020, Truecaller launched a corresponding offering that targets corporates. This part of the business allows B2B customers to be listed as verified callers when they call private people. It can for example be a security company that calls about an alarm or a courier company that needs to get in contact with a receiving customer. It is a common problem that these types of companies get rejected when the call-receiver doesn’t recognize the number.
Truecaller declares that their product benefits from network effects. i.e., the product gets better the more people who use it (think Facebook). This can be relatively easy to appreciate since phone number identification inherently evolves from reporting of unwanted calls by the users, i.e., when enough people have reported an unwanted call Truecaller flags for this in the app). Over time, Truecaller has built a database containing 5.7 billion unique phone-identities. Network effects doesn’t just build a better product over time, they also increase the entry-barriers for potential competition.
The majority of Truecaller’s income comes from developing countries. The company explains that the problems related to spam emails, harassment, unwanted calls, and messages are more common there than in the western world. India is Truecaller’s largest market where these types of problems are significant. One positive aspect of the geographical exposure is that it allows for a nice structural tailwind: the population growth in developed markets is much higher than in the west (driven by an increasing average age) and the smartphone penetration is growing fast.
Historically, 97 percent of all app downloads have been organic. However, management has begun to experiment with user acquisitions by the way of advertisements through, for example, Facebook. The returns on user acquisition looks extremely attractive. In some markets, such as India, Truecaller could achieve a return on investment of up to 20x on every spent dollar. In more mature markets, such as the USA, the same multiple amounts to 4x, still very attractive. Indonesia, which is a relatively new market to the company, has a multiple of 0.8x. This means any user acquisition spend in Indonesia is unprofitable at this point. However, management is confident that the return profile will wander above the 1x as more users join and the network effects take place. In summary, the investment opportunities are plentiful and attractive – and unique.
In summary, several things speak for significant growth in the future. The investment in paid user acquisition, a sharpened premium-offer, the newly launched B2B product and continued growth of the advertising business. In addition to this, acquisitions may likely follow.
Growth has been prioritized over profitability and it is only recently that the company began to report profits. In 2019 sales grew by 57 percent. In 2020 the corresponding figure was 64 percent, and during the first half of 2021 the company’s sales grew with as much as 151 percent in comparison to the same period last year (which was partly affected by the pandemic). During the first half of this year, the company’s operating margin was 32 percent. As you can imagine, Truecaller is very capital-efficient. Working capital is very low which gives a nice cash conversion and a very high return on capital employed – all attributes that are required to create a very successful and valuable company over time.
Truecaller targets a revenue growth of at least 45 percent between 2021-2024e. After 2024 the EBITDA-margin should be at least 35 percent. The sum of the year-on-year growth and the EBITDA-margin should amount to at least 70 percent (a variant of the rule of 40 that tries to balance growth and profitability). We don’t think it will be difficult to reach these targets and the analyst estimates we have looked at are cautious, especially regarding profitability. In our preliminary prognosis for 2023, our EBITDA-estimate is around 16 percent ahead of the analyst estimates that we’ve studied. This is based on that Truecaller can continue to grow sales much faster than hiring new people while the gross margin improves slightly in coming years.
The gross margin is an interesting aspect of the equity story. Truecaller’s gross margin amounts to approximately 70 percent. Most of the cost of sales consists of platform fees to Apple and Google. Since Apple and Google practically control the distribution channels for apps together, a duopoly has occurred and prices for app-developers such as Truecaller have remained high around 25-30 percent of sales. This situation is now heavily criticized from all parts of the world since the situation is not considered competitive, for example
look at this analysis about an American court ruling concerning a twist between Epic Games and Apple. We believe Google and Apple’s fees will decrease over time – which would be a positive event for Truecaller. Furthermore, Truecaller’s new business deal bypasses Goggle and Apple, which gives a gross margin of close to 100 percent. This will strengthen the profitability even more.
There are of course risks associated with the dependence on Google/Apple (which is the case for every company in the application business); the geographical exposure and one should never write off the threat of competition even if it seems far away at this stage. However, we do believe the benefits outweighs the negatives. Truecaller has excellent financial characteristics, operational founders with large shareholdings who will remain active in the business and some of the world’s most well-known investors behind it. We therefore look forward to being included as an anchor investor ahead of the stock exchange listing on October 8th. We are even more excited to follow the company’s successes in current and new markets in the coming years.
CVS Group
One of the happiest days of the month was when our veterinarian company CVS Group released their interim numbers. Once again, the company beat analysts’ expectations which have been raised several times over the course of the year. In the first two months of the new financial year (which begins in July), the company has grown by 17 percent. This can be compared with the growth expectations for the full year which, before the report release, were 7 percent. Once again, analysts have thus far been “forced” to upgrade their assumptions. In a sour September stock market, the share fell 3 percent.
It becomes clear that the positive effect of the pandemic on pet ownership is more tenacious than ever. Pets live for many years, and we believe many underestimated the importance of the large number of new customers during the pandemic. Below is a graph of Google searches for veterinarians in the UK as well as data from the Swedish Board of Agriculture regarding the number of newly registered dogs. We speculate that the UK has similar trends as Sweden. The data points are also positive for our other pet company Swedencare. Pet companies are obviously still hot; right now there’s a bidding war going on over the German pet company Zooplus, where EQT is currently in the lead with the highest bid. We also note that there have been several venture capital-led acquisitions of veterinary companies at higher multiples than CVS is valued at.

Source: Jordbruksverket, Coeli

Source: Google Trends, Coeli
Lindab
Since our first investments in Lindab in the autumn of 2019, the thesis has always been that the building systems business segment did not fit into the business and in September, management finally found a buyer for the company. The transaction entails a write-down of goodwill corresponding to SEK 430 million, but it is cash flow neutral. Lindab took the opportunity to update its financial targets; the company now wants to grow by 10 percent per year (of which approximately two thirds are through acquisitions) and reach an operating margin of at least 10 percent (previously 10 percent over a business cycle). The share responded positively to the message.
We noted broad insider purchases in Lindab during the month, also from CEO Ola Ringdahl himself, which we think bodes well for the report in October. Despite this the share price decreased 8 percent in September.
Victoria
We have written several times about the British flooring company Victoria, which in September had a weak share price development of 17 percent. By all accounts, the company is doing well – during the month it was reported that sales rose 70 percent compared to 2020, and 50 percent compared to 2019. If you only partially extrapolate these figures for the rest of the year, it is obvious that analysts’ expectations are too low. We believe that this month’s decline is related to flows: growth companies and small and mid-cap companies were some of the most affected sectors in September – Victoria was hit from both sides. We have increased our position in recent days.
The Pebble Group
One of the month’s (few) joys was Pebble Group. As we previously wrote, the company is active in the market for gift advertising, i.e. gifts that companies give to customers, employees, and other stakeholders for marketing purposes. In September the company came out with its half-year figures that were better than expected. Pebble’s software division, Facilisgroup, is growing better than our expectations. This is also the part we believe the market is valuing too low. The stock rose 10 percent in September.
Knaus Tabbert
During the last trading day in September, our German motorhome manufacturer Knaus Tabbert announced that the forecasts for 2021 must be lowered due to component shortages. We are not particularly surprised that this has happened given what we have seen from other vehicle manufacturers. If the company can remedy these supplier problems, management believes that 2022 will be unaffected at best, as Knaus still has a bursting order book, increased production capacity and more suppliers from January next year. The share fell 7 percent in September.
Short positions
The short portfolio contributed with a negative result during the month. Our short-term negative positions in the German DAX had the largest negative contribution. Some stock specific short positions that contributed positively to the result were Swedish Dometic, German Henkel and Norwegian NEL.
Exposure
The net exposure, adjusted for our unlisted holdings, at the beginning and end of the month was 76 and 74 percent, respectively.
Summary
September's negative return of x percent also meant the end of the fund's, so far, longest period of positive return (10 months). We are obviously disappointed with that, but we have been in the game long enough to understand that equities sometimes must fall to be able to refuel and continue their upward trajectory. In general, September was the weakest month for many equities since the crisis started 1.5 years ago. September, otherwise, started strong for us and was a continuation of an unusually good performance at the end of August. Our companies presented many good news (except for Knaus Tabbert on the last day of the month) but small-caps and especially those categorized as growth shares, had a very weak performance during September. The main reason for this was, as previously mentioned, the change in the US long-term interest rate and general "risk off".
The picture below shows the development since March last year compared with the corresponding time intervals in the financial crisis in 2009 and onwards. Both periods have shown an unusually strong recovery and the current trend is even stronger than when the financial crisis raged 12 years ago.

Source: Goldman Sachs
Since the crisis started 1.5 years ago, we have had three different phases. The first and shortest, "despair", showed a decline in prices of 33 percent. The second phase, "hope", ended at the beginning of this year and showed a very strong return of 79 percent despite declining earnings. The last, “growth”, where we are now, has shown +11 percent in share prices with sharply rising growth for companies' earnings, but at lower valuations.

Source: Goldman Sachs
The recovery for American companies (below) has been extremely strong and compared to 2019, the 2021 profits will be approximately 36 percent higher. Very impressive.

Source: Goldman Sachs
It is very gratifying that Europe, for once, is keeping up with the United States and showing strong profit growth. Compare this with the non-existent profit growth between 2007–2019 (!)

Despite rising equity prices, valuations have fallen and Europe is now trading around 16x the profit 12 months ahead. It's not very strenuous (we think). For an average commercial property, you can get a return of maybe 3 percent before net financial costs. After financing, this corresponds to at least P/E 50x. And paying to lend to different countries does not feel like an exciting alternative either.

Source: Goldman Sachs
The valuation of global shares in relation to global GDP looks more strained. A major reason for this is the central banks' aggressive policy.

The valuation of the major leading technology companies is at an average level seen from the last five years.

Source: Goldman Sachs
The image below is striking. It shows that Swedish property prices, which have risen by almost 200 percent over the past 15 years, have had the same development as the money supply. In theory, price per m2 and krona is unchanged for the past 15 years. Is there anyone who still doubts that the world's central banks are responsible for the largest wealth creation in human history? It is important to be on the wagon because when it is gone you’ve missed it. And what central banks cannot push, the price of bitcoin for example, rises even more as central banks cannot make more of it. The opportunities for central banks to reverse the band are few. In the long run, this means that the next 10 years will, overall, be a good period for, for example, stock picking. All forms of uniqueness (growth) will be highly valued to compensate for the fact that the value of money decreases at a rapid pace.

If there is anyone who is still not convinced, take a look at the picture below. The market capitalization of the S&P500 divided by the Fed's balance sheet….

Source: Bloomberg
Onwards and upwards. The wealth of American households is accelerating away from the change in GDP.

Thank you Fed and all the world central banks!

Citigroup's surprise index has weighed down and analysts' profit estimates are also starting to soften. Not a good combination and it has undoubtedly contributed to the weak development in the stock markets recently.

It took a full 219 days for the S&P500 to have a decline of 5 percent. We will see how high the next bar will be.

Timing is everything. A fascinating graph that shows the importance of having reasonable timing in decisions.

Source: Goldman Sachs
Despite a difficult month behind us, it feels reasonable to expect a stronger market during the last quarter of the year. Our view is that we are still in a rising market, although we are likely to experience some turbulence for a few more weeks. "Bear markets" are constantly declining with sharp rallies while "bull markets" continue to rise with some strong drawdowns. We therefore believe that we are still in a rising market.
Some statistics to cheer you up. The S&P500 managed to rise by 0.2 percent in the third quarter (Europe -1.9 percent) which means six consecutive positive quarters. This has only happened eight times before and only on one of the (eight) occasions has the following quarter yielded a negative return. Two quarters later, it has in all cases yielded a positive return. In addition, for the past 20 years, October has been the fourth best month, thus much better than its reputation. Having pointed that out, October takes first place in terms of most frequent daily movements that exceed one percent.
The Stockholm Stock Exchange, which is an excellent reference point, had risen by 30 percent at its highest about a month ago, but is currently at 20 percent. Even more important is that measured in USD, OMX has "only" risen by 13 percent, which is in line with the US stock markets. This is hardly excessive given the profit growth among the companies. The risk premium in the market is high.
Investors are reasonably careless, and we are approaching the turn of the year. Global growth is well above average and interest rates are extremely low. Given how cruel the market has been to many investors this year, with sector rotations and a high concentration of companies driving performance, it almost feels obvious that the broad mass of investors will continue to reduce risk in their portfolios and then be short equities at year-end when the market rises. We'll see, but that's our main scenario right now.

We are now closing the books for the third quarter, and we look forward to the end of the year and above all the entrance for Truecaller on the Stockholm Stock Exchange on October 8!
Thank you for this month and we'll hear from you later.
Mikael & Team
Malmö on 5 October
[/et_pb_text][et_pb_text admin_label="Coeli Nordic Corporate Bond Fund R-SEK" _builder_version="3.0.89" background_layout="light" module_class="gen-table-module" disabled_on="on|on|on" disabled="on"]
Coeli Nordic Corporate Bond Fund
| Performance in Share Class Currency | 1 Mth | YTD | 3 yrs | Since incep |
| Coeli Nordic Corporate Bond Fund - R SEK | 1.30% | -0.93% | 3.38% | 14.52% |
| | | | |
[/et_pb_text][et_pb_text admin_label="Coeli Nordic Corporate Bond Fund R-SEK" _builder_version="3.0.89" background_layout="light" module_class="gen-table-module" disabled_on="on|on|on" disabled="on"]
[cg_linear_graph id="31122"]
[/et_pb_text][et_pb_image _builder_version="3.0.89" src="https://coeli.com/wp-content/uploads//2020/10/ncbr.png" show_in_lightbox="off" url_new_window="off" use_overlay="off" always_center_on_mobile="on" force_fullwidth="off" show_bottom_space="on" disabled_on="on|on|on" disabled="on" /][/et_pb_column][et_pb_column type="1_3"][et_pb_image _builder_version="3.0.89" src="https://coeli.com/wp-content/uploads/2019/01/Gustav-Fransson6.jpg" show_in_lightbox="off" url_new_window="off" use_overlay="off" always_center_on_mobile="on" force_fullwidth="off" show_bottom_space="on" custom_margin="||21px|" disabled_on="on|on|on" disabled="on" /][et_pb_text admin_label="Namn och title" _builder_version="3.0.89" background_layout="light" module_class="gen-single-ingress-module" custom_margin="||40px|" disabled_on="on|on|on" disabled="on"]
Gustav Fransson
Portfolio Manager of Coeli Nordic Corporate Bond Fund
[/et_pb_text][et_pb_image _builder_version="3.0.89" src="https://coeli.com/wp-content/uploads/2018/10/Alexander-Larsson-Vahlman.jpg" show_in_lightbox="off" url_new_window="off" use_overlay="off" always_center_on_mobile="on" force_fullwidth="off" show_bottom_space="on" custom_margin="||21px|" disabled_on="on|on|on" disabled="on" /][et_pb_text admin_label="Namn och title" _builder_version="3.0.89" background_layout="light" module_class="gen-single-ingress-module" custom_margin="||40px|" disabled_on="on|on|on" disabled="on"]
Alexander Wahlman
Senior Analyst
[/et_pb_text][et_pb_text admin_label="Fund Overview" _builder_version="3.0.89" background_layout="light" custom_margin="||20px|" module_class="gen-trustee-single-table"]
Fund Overview
| Inception Date | 2017-12-20 |
| Investment management fee (share class I SEK) | 1.00% p.a + 20% Performance fee (OMRX T-Bill Index) |
| Performance Fee. Yes | 20% |
| Risk category | 5 of 7 |
[/et_pb_text][et_pb_text admin_label="Top Holdings (%)" _builder_version="3.0.89" background_layout="light" custom_margin="||20px|" module_class="gen-trustee-single-table" disabled_on="on|on|on" disabled="on"]
Top Holdings (%)
| LANSBK 1.25% 18-17.09.25 | 4.1% |
| NORDEA HYP 1.0% 19-17.09.25 | 4.1% |
| SWEDBK 1.0% 19-18.06.25 | 4.1% |
| WHITE MOUNT FRN 17-22.09.47 | 3.9% |
| B2 HOLDING FRN 19-28.05.24 | 2.9% |
[/et_pb_text][/et_pb_column][/et_pb_row][/et_pb_section][et_pb_section bb_built="1" fullwidth="off" specialty="off" _builder_version="3.0.89" module_class="gen-trustee-single-yield-section gen-pattern-section" custom_padding="0px|||"][et_pb_row _builder_version="3.0.89" custom_padding="||53px|"][et_pb_column type="4_4"][et_pb_text admin_label="VIKTIG INFORMATION" _builder_version="3.0.89" background_layout="light" module_class="gen-trustee-single-warning-blurb"]
IMPORTANT INFORMATION. This is a marketing communication.
Before making any final investment decisions, please refer to the prospectus of Coeli SICAV II, its Annual Report, and the KID of the relevant Sub-Fund. Relevant information documents are available in English at coeli.com. A summary of investor rights will be available at
https://coeli.com/regulatory-information-coeli-asset-management-ab/.
Past performance is not a guarantee of future returns. The price of the investment may go up or down and an investor may not get back the amount originally invested.
[/et_pb_text][/et_pb_column][/et_pb_row][/et_pb_section]